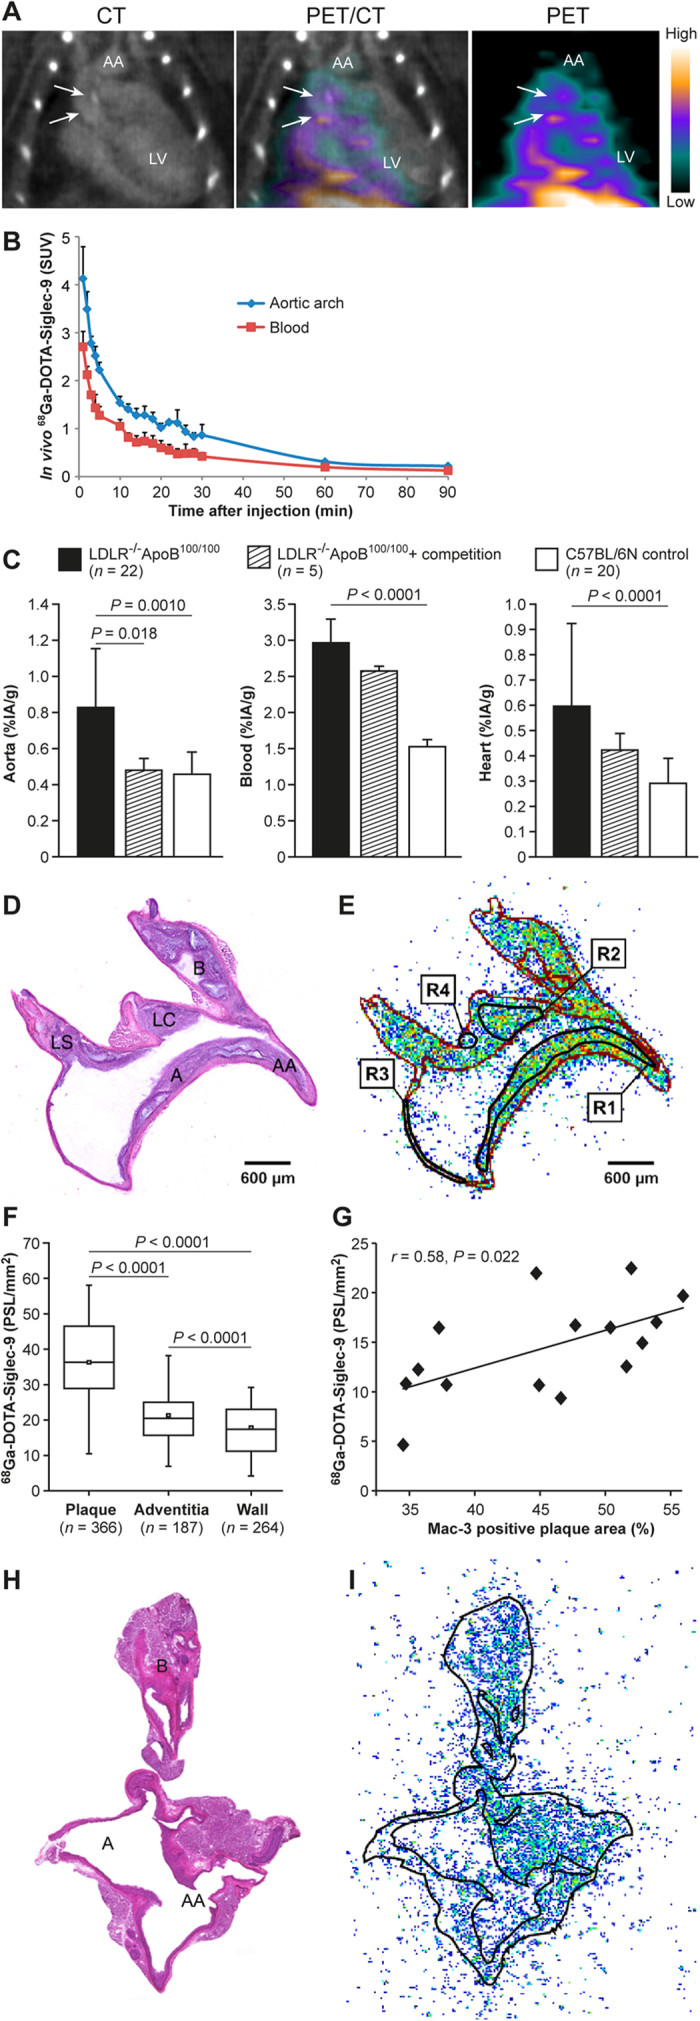
Figure 2. Accumulation of vascular adhesion protein-1 (VAP-1)-targeting sialic acid-binding immunoglobulin-like lectin 9-based radioligand ([68Ga]DOTA-Siglec-9) in atherosclerotic plaques.

(A) Representative thoracic contrast-enhanced computed tomography (CT), positron emission tomography (PET)/CT and PET images of a LDLR−/−ApoB100/100 mouse at 10−20 min after tracer injection created using Inveon Research Workplace software (Siemens Medical Solutions, Knoxville, TN, USA) shows calcified atherosclerotic plaques (arrows) in the aortic arch (AA). The in vivo [68Ga]DOTA-Siglec-9 PET detects atherosclerotic plaques in the aortic root with target-to-background ratio (SUVmax, aortic arch/SUVmean, blood) 2.0. LV = left ventricle cavity. SUV = standardized uptake value. (B) Time-activity curves in regions of interest of atherosclerotic mice. Lines represent mean and error bars the standard deviation (n = 3). (C) Ex vivo biodistribution results expressed as a percentage of injected radioactivity dose per gram of tissue (%IA/g). Values are mean and error bars standard deviation. P values, ANOVA with Tukey’s correction. (D–G) Autoradiography analysis of aorta cryosections. (D) Hematoxylin-eosin staining of a longitudinally sectioned LDLR−/−ApoB100/100 mouse aorta. (E) Superimposed autoradiograph and hematoxylin-eosin staining (red lines represent the borders of the hematoxylin-eosin image). R1 and R2 are regions of interest (ROI) in the plaque (excluding the media); R3 is the ROI in the normal vessel wall (no lesion formation); R4 is the ROI in the adventitia (mainly adipose tissue around the aorta). A = arch; AA = ascending aorta; B = brachiocephalic artery; LC = left common carotid artery; LS = left subclavian artery. (F) Quantitative autoradiography of LDLR−/−ApoB100/100 mice aorta (n = 22). P values, ANOVA with Tukey’s correction. (G) Pearson’s correlation analysis of tracer uptake and Mac-3-positive macrophage density in atherosclerotic plaques. PSL/mm2 = photostimulated fluorescence per square millimeter. (H) Hematoxylin-eosin staining of a longitudinally sectioned healthy C57BL/6N control mouse aorta. (I) Superimposed autoradiograph and hematoxylin-eosin staining (the black line represents the borders of the hematoxylin-eosin image).
