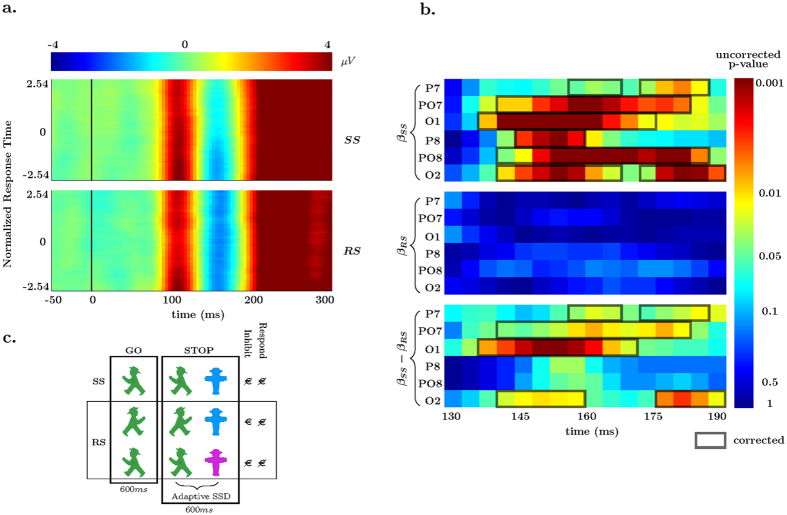
Figure 1. Response Time Effects.
(a) Averaged N1 EEG electrodes (O1, O2, PO7, PO8, P7, P8) data plotted by normalized (per individual) response times in the standard-stop context (top) and rewarded-stop (bottom). (b) Uncorrected p-values for the standard-stop (SS, top) 1-sample t-test, reward-stop (RS, middle) 1-sample t-test, and paired-sample t-test (bottom) for six electrodes. Significant temporally corrected values at α = 0.05 are overlaid. (c) Stimuli and paradigm (flanking stimuli are not shown) showing go-trials, stop-trials, and potential payouts for stop-trials in both the SS and RS blocks. The color coupled to reward (blue in the example) for a successful inhibition was instructed before the block began.

