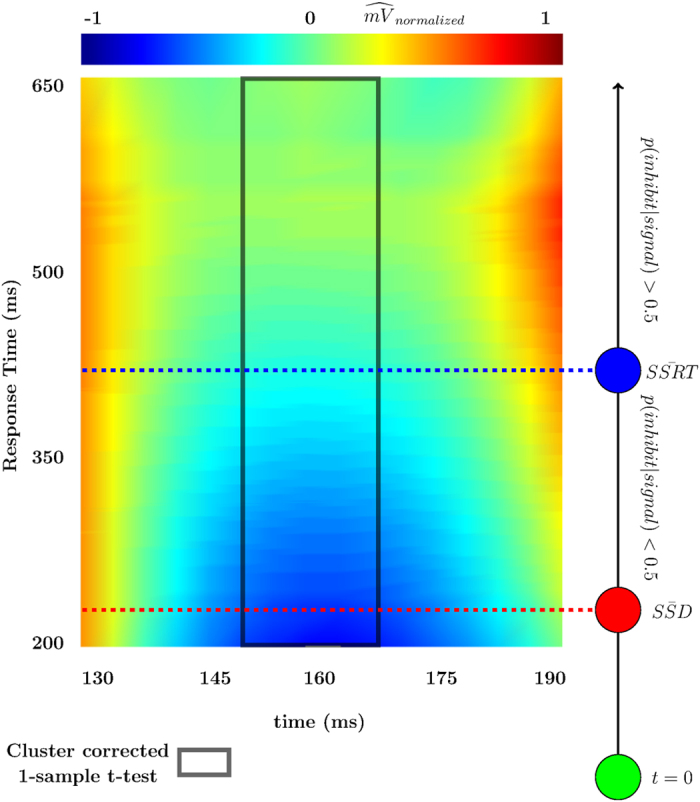
Figure 2. Model Prediction.

Predicted voltages individually normalized and then averaged across individuals plotted by response time and time since go presentation. Electrode plotted for each individual was the electrode from the optimized r2 vector. Significant cluster from 1-sample t-test overlaid on top. To the right the relationship between SSRT, SSD, and p(inhibit|signal) are shown in relation to go-RT and the single trial N1.
