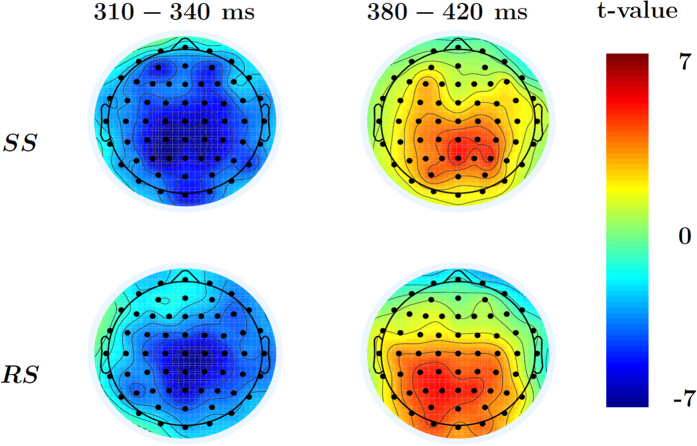
Figure 4. 1-sample t-test on EEG-response-time relationship between 200 and 600 ms.
t-values from 1-sample RT β t-tests averaged within the significant cluster corrected time ranges for both the early and late components. The data indicate a negative relationship between RT and EEG data in the N2 range, and a positive one in the P3 range, albeit only for the RS context after multiple-comparison correction.

