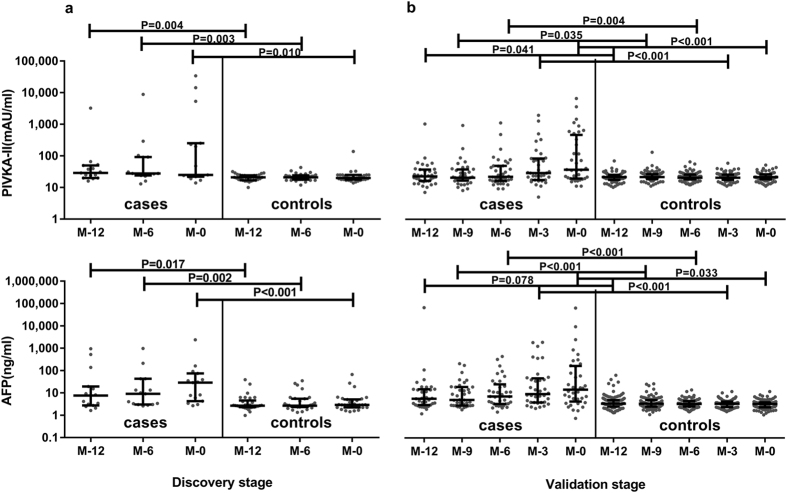
Figure 1. Levels of PIVKA-II and AFP at all time points at discovery stage and validation stage.
Gray points refer to each value and dark lines refer to the 25th and 75th percentile values with a long dark line indicating median levels. P values were calculated by Mann-Whitney tests between two columns.

