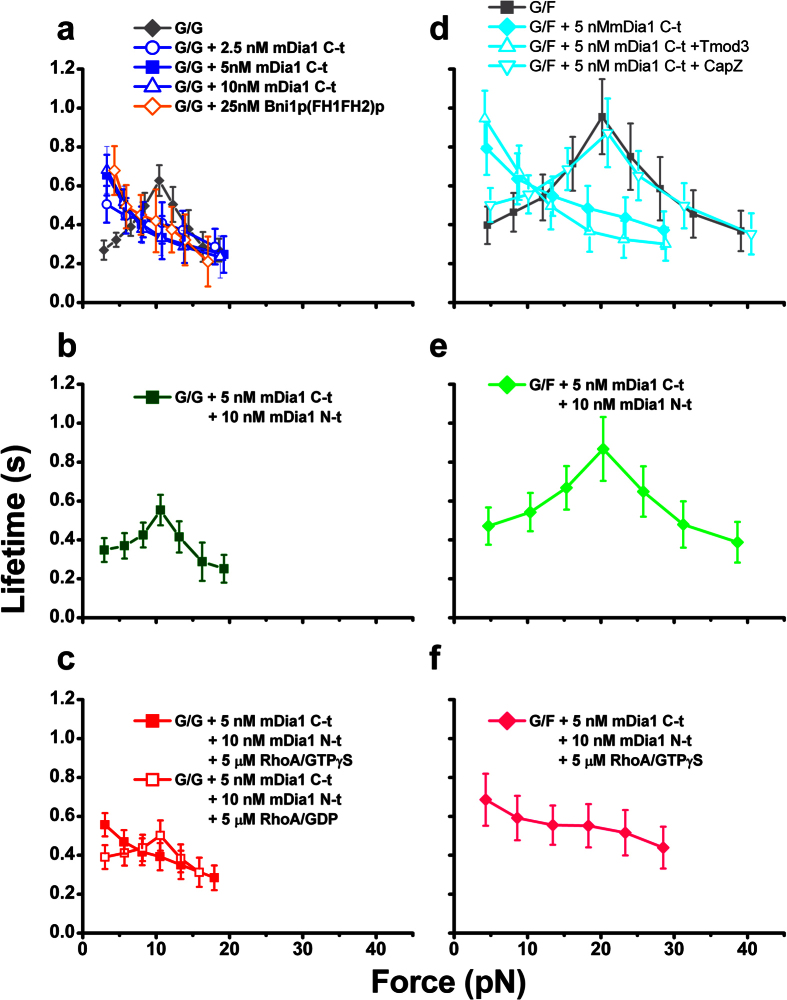
Figure 2. Switching between actin catch-slip bonds and slip bonds by a RhoA-mediated auto-inhibitory module of mDia1.
(a) mDia1 C-t (blue symbols) or Bni1 (FH1FH2)p (orange open diamond) converted G-actin/G-actin catch bonds (gray diamond, data presented in cited ref. 20) to slip-only bonds, in the force range measured (b) mDia1 N-t inhibited the mDia1 C-t-induced conversion of G-actin/G-actin catch-slip bonds to slip-only bonds, restoring the catch-slip phenotype. (c) His RhoA charged with GTPγS (red square), but not GDP (red open triangles), relieved the inhibitory effect of mDia1 N-t on mDia1 C-t. (d) G-actin/F-actin catch-slip bonds (gray square, data presented in cited ref. 20) were converted to slip-only bonds by 5 nM mDia1 C-t (blue diamond), the effect of which was exacerbated by 2 μM Tmod3 (open up triangle) but diminished by 10 nM CapZ (open down triangle). (e) mDia1 C-t-induced conversion from G-actin/F-actin catch-slip bonds to slip-only bonds was inhibited by simultaneous treatment with mDia1 N-t. (f) The inhibitory effect mDia1 N-t on mDia1 C-t was relieved by His RhoA charged with GTPγS. Each point represents the mean ± 95% confidence interval (C.I.) of >30 measurements. The confidence interval is calculated as the standard error multiplied by the t statistic from the t table, assuming a t-distribution with a degree of freedom of sample size minus 1. The semilog plots of survival frequency versus lifetime for the G-actin/G-actin interaction with 5 nM mDia1 C-t, G-actin/F-actin interaction with 5 nM mDia1 C-t and 2 μM Tmod3 were shown in the Fig. S9.

