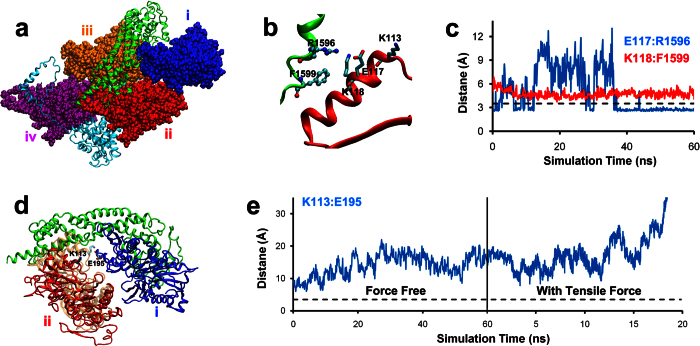
Figure 3. SMD simulations of a structural model of actin barded end oligomer in complex with formin.
(a) The formin-actin complex model constructed according to the crystal structure 1Y6411. Four actin subunits were represented in blue (i), red (ii), orange (iii) and purple (iv), sequentially from bared to pointed end, respectively. Two formin FH2 subunits were displayed as green and cyan. (b) The contact interface between formin and the actin helical segment spanning through residues 113 to 118. (c) Time courses of distance between the indicated atoms of residues indentified in (b). An inter-atomic distance below the 3.5 Å threshold indicates the formation of the salt bridge. (d) The FH2 domain-bound inter-strand actin subunits (i and ii) at the barbed end. The barbed-end subunits from the previously-simulated formin-free F-actin20 was taken as the reference conformation, with the subunit (i) superimposed (blue) and adjacent subunit (ii) depicted in red (formin-bound) or light orange (formin-free). (e) Time courses of distance between K113 and E195. (c,e) are representatives of more than 3 simulations for each panel.

