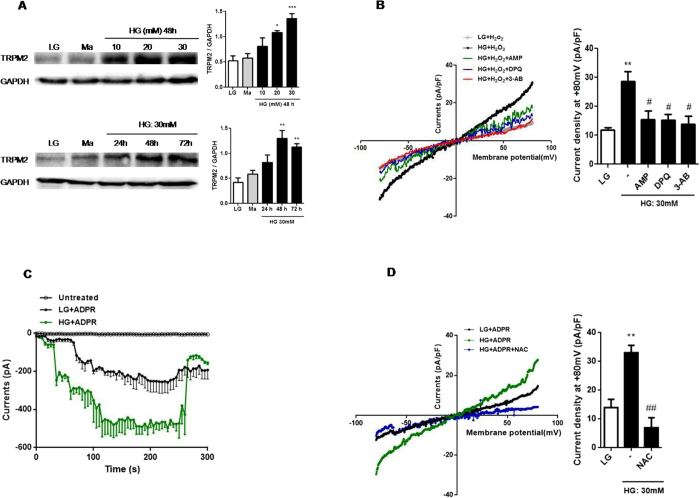
Figure 1. HG enhanced TRPM2 protein expression and its activity via ROS production in U937 monocytes.
(A) Representative immunoblots and graphs for TRPM2 expression induced by low glucose (LG; 5.5 mM glucose), mannitol (Ma; 30 mM), high glucose (HG; 10, 20, 30 mM glucose for 48 h, or 30 mM glucose for 24, 48, 72 h) in U937 cells; Relative expression of TRPM2 protein was normalized to GAPDH (n = 4). (B–D) Representative current-voltage relationship and TRPM2-like current density induced at +80 mV (B) by extracellular H2O2 (1 mM) in the presence of adenosine monophosphate (AMP; 100 μM), or pre-treatment with 3-aminobenzamide (3-AB; 5 mM) or 3,4-dihydro-5-[4-(1-piperidinyl)butoxy]-1(2H)-isoquinolinone (DPQ; 100 μM) (n = 6–8) or (C) by intracellular denosine 5′-diphosphoribose (ADPR; 1 mM) under LG or HG (30 mM glucose for 48 h) in U937 cells (n = 7–10), or (D) by intracellular ADPR (1 mM) with pre-treatment of N-acetyl-L-cysteine (NAC; 25 mM) under HG condition in U937 cells (n = 6–9). Data shown were representative of four or five independent experiments (mean ± S.E.M.). (A,B) *P < 0.05, **P < 0.01 and ***P < 0.001 vs. LG; #P < 0.05 vs. HG.

