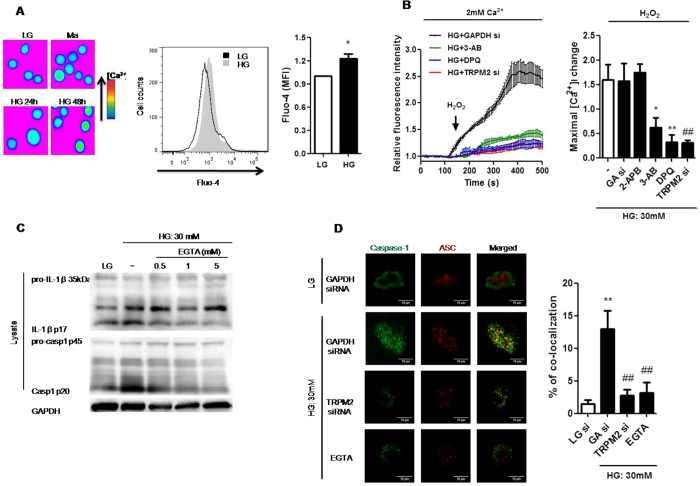
Figure 3. Ca2+ influx via TRPM2 was required for HG-induced NLRP3 inflammasome activation in U937 cells.
(A) Fluorescence images showing fluo-4-loaded cells taken at indicated timepoints, and representative flow cytometric plot and graph showing relative median fluorescence intensity (MFI) of intracellular Ca2+ concentration by Fluo-4 staining under low glucose (LG; 5.5 mM glucose;) or high glucose (HG; 30 mM glucose) (n = 5). (B) Relative changes in [Ca2+]i, evoked by H2 O2 (1 mM) over the time course. The cells were treated in the presence of 2-aminoethoxydiphenyl borate (2-APB; 100 μM), or with pre-treatment of 3-aminobenzamide (3-AB; 5 mM) or 3,4-dihydro-5-[4-(1-piperidinyl)butoxy]-1(2H)-isoquinolinone (DPQ; 100 μM), or GAPDH- (GA si) or TRPM2-siRNAs (TRPM2 si) under HG (n = 4). (C) Representative immunoblots for pro-IL-1β, IL-1β p17, pro-caspase-1, cleaved caspase-1 (p20), and GAPDH in the presence of EGTA-AM (0.5, 1, 5 mM) under HG (n = 4). (D) Immunofluorescence images showing the location of caspase-1 and ASC in fixed cells using confocal microscopy in the presence of GAPDH- or TRPM2-siRNAs, or EGTA-AM (5 mM) under HG. The percentage of co-localization of caspase-1 with ASC was calculated as the average volume of the overlapping areas (n = 4). Data were shown as mean ± S.E.M. (A) *P < 0.05 vs. LG. (B) *P < 0.05 and **P < 0.01 vs. HG; ##P < 0.01 vs. HG + GA si. (D) **P < 0.01 vs. LG + GA si; ##P < 0.01 vs. HG + GA si.

