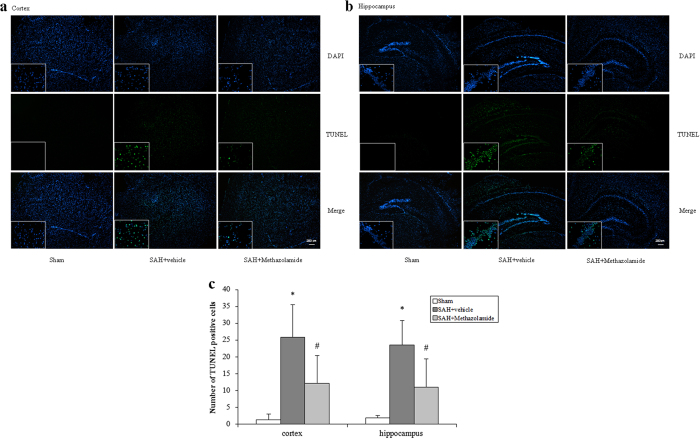
Figure 4. TUNEL staining of cortex and hippocampus of bleeding side.
(a) Representative images of TUNEL staining of cortex. (b) Representative images of TUNEL staining of hippocampus. Scale bar = 200 μm. (c) The positive rate of the SAH + vehicle group and SAH + methazolamide group were increased (*P < 0.01) compared with sham group, while the positive rate of SAH + methazolamide group was lower than the SAH + vehicle group (#P < 0.05). N = 5 mice for each group.

