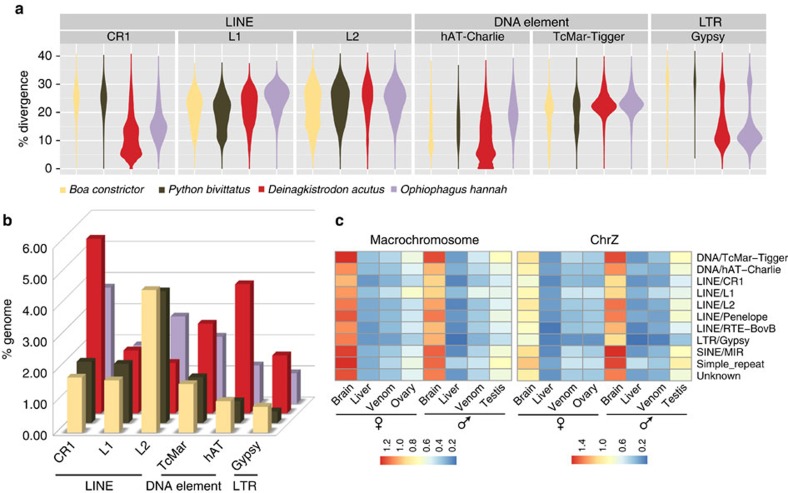
Figure 2. Genomic and transcriptomic variation of snake transposable elements.
(a) Violin plots showing each type of TE's frequency distribution of sequence divergence level from the inferred ancestral consensus sequences. Clustering of TEs with similar divergence levels, manifested as the ‘bout' of the violin, corresponds to the burst of TE amplification. (b) Bar plots comparing the genome-wide TE content between four snake species. TE families were annotated combining information of sequence homology and de novo prediction. (c) TE's average normalized expression level (measured by RPKM) across different tissues in five-pace viper.

