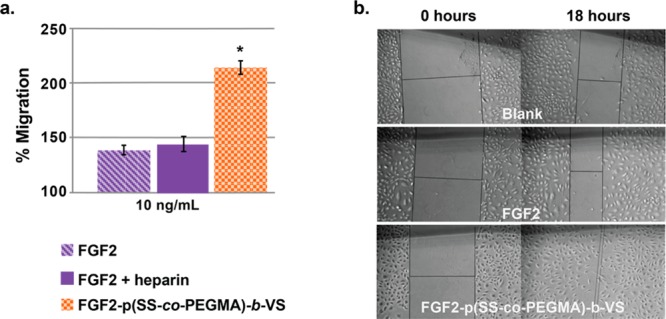
Figure 5.

HUVEC migration after 18 h. (a) Percent migration in the presence of FGF2, FGF2 plus 1 μg/mL of heparin, or FGF2-p(SS-co-PEGMA)-b-VS. Percent migration was calculated using the formula: 100% – (distance at T0/distance at T18) and blank medium was set at 100%. Each sample contained four to six replicates and the experiment was repeated three times, with each repeat being blinded. Error bars represent SEM. (b) Representative images of HUVEC migration taken at 0 and 18 h. Statistical analysis was done using Student’s t test. * p < 0.01 compared to FGF2.
