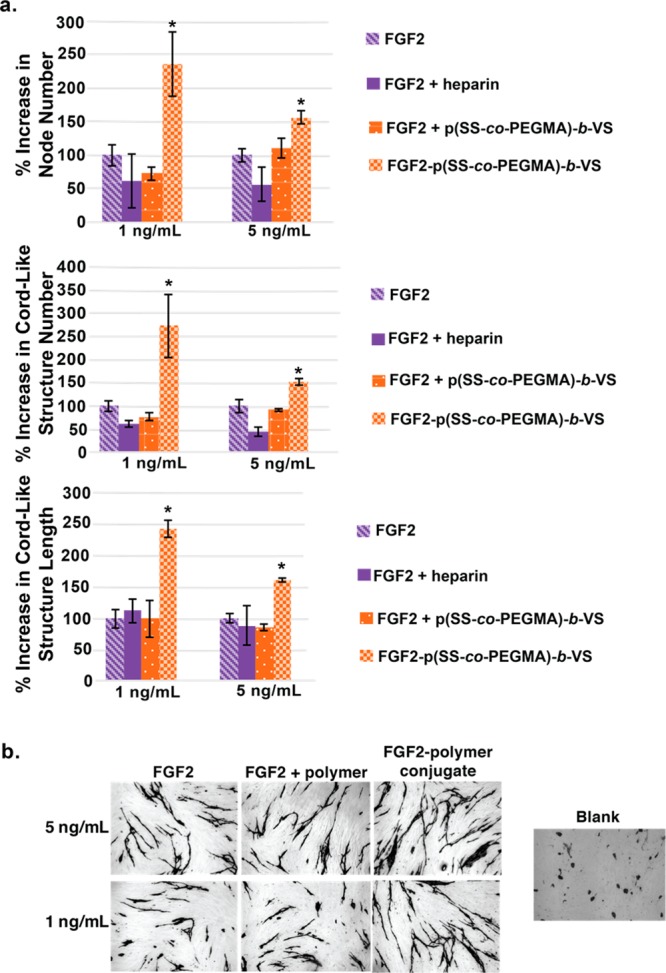
Figure 6.

Coculture angiogenesis of HUVEC and HDF. (a) Node number, cord-like structure length and cord-like structure number. (b) Representative images of cord-like structures stained for CD31. Three replicates per sample, error bars represent SEM. Statistical analysis was done using Student’s t test. * p < 0.01 compared to FGF2.
