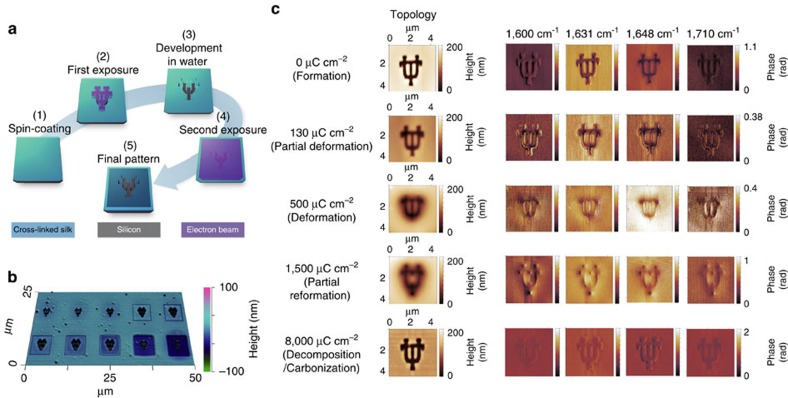
Figure 2. Direct visualization of electron-directed structural transitions of β-sheets using near-field IR nano-imaging.
(a) Illustration of a two-step EBL process for sample preparation. First, an area of 3 × 3 μm (in the shape of a ‘UT' logo, line width: 200 nm) was patterned using EBL followed by a water development, which provided a clear contrast between silk and silicon and facilitated the following spectroscopic imaging/characterization. Then, a second step of electron irradiation was used to induce localized structural transitions in silk (5 × 5 μm squares) by delivering ebeams at various dosages. (b) AFM topographic images of silk nanopatterns fabricated using EBL at the dosages ranging from 0 to 8,000 μC cm−2. (c) IR nano-imaging using s-SNOM: the phase contrast between silk and silicon (a flat spectral response in the mid-IR) in each IR image correlates to the absorption of silk proteins (that is, the surrounding area of ‘UT' logos) of various structures at that wavenumber, and the comparison of contrast differences between the IR images (for instance, those in column 3 and column 4) implies the dominant protein structure within the amide I vibration bands (for example, 1,631 cm−1 for β-sheets and 1,648 cm−1 for random coils).

