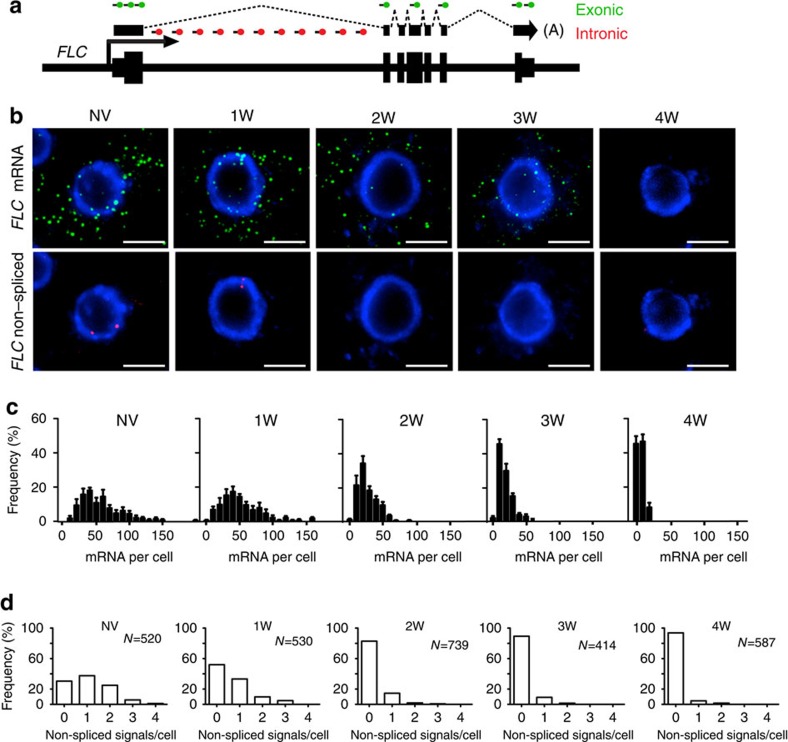
Figure 1. Single-cell quantification of mRNA expression and FLC transcription during vernalization.
(a) Schematic of the probes used to detect FLC transcripts: intronic (red) and exonic (green). (b,c) Cytoplasmic FLC mRNA decreases gradually in the cold. (b) Representative images of cells showing the gradual decrease of FLC mRNA (green) and the reduction in nuclear non-spliced FLC transcripts (red) in the cold. DNA labelled with DAPI (blue). Scale bar, 5 μm. (c) Frequency distribution of FLC mRNA molecules per cell in non-vernalized plants (NV) and after different weeks of cold (1W, 2W, 3W, 4W). (d) Quantification of active sites of transcription as judged by non-spliced signal at the time points depicted in c. N=number of cells analysed. All error bars are +/−s.e.m.

