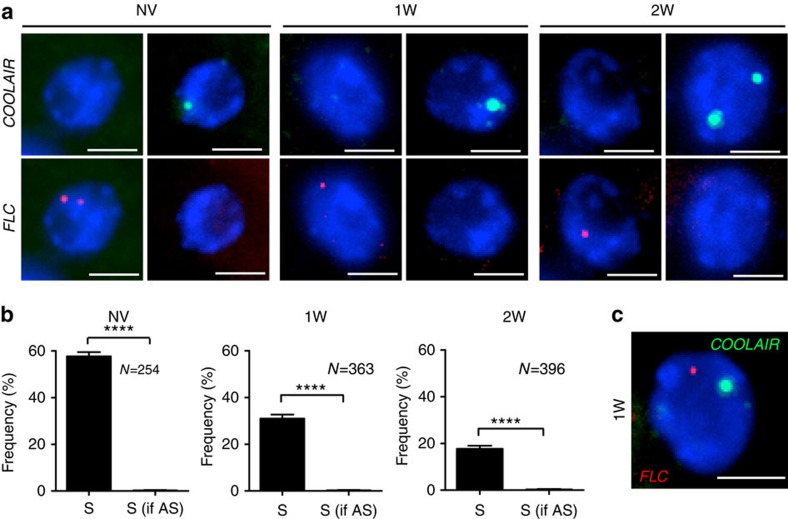
Figure 3. FLC and COOLAIR transcription are anti-correlated at the level of the locus.
(a) Representative images of nuclei hybridized with intronic smFISH probes for COOLAIR (green) and FLC (red) showing mutually exclusive transcription. Plants were given no cold (non-vernalized plants (NV)) or different weeks of cold (1W, 2W). DNA labelled with DAPI (blue). Scale bar, 5 μm. (b) Frequency of loci transcribing FLC, when COOLAIR is not present (S) or is detectable at the same locus (S if AS). FLC and COOLAIR transcription are anti-correlated at the level of the gene throughout all time points analysed (NV, 1W, 2W). N=number of cells analysed. All error bars are +/−s.e.m. (c) Representative image of a nucleus hybridized with intronic smFISH probes against non-spliced COOLAIR (green) and FLC (red) in plants exposed to 1-week cold (1W), showing transcription of FLC and COOLAIR from different alleles in the same cell. Scale bar, 5 μm.

