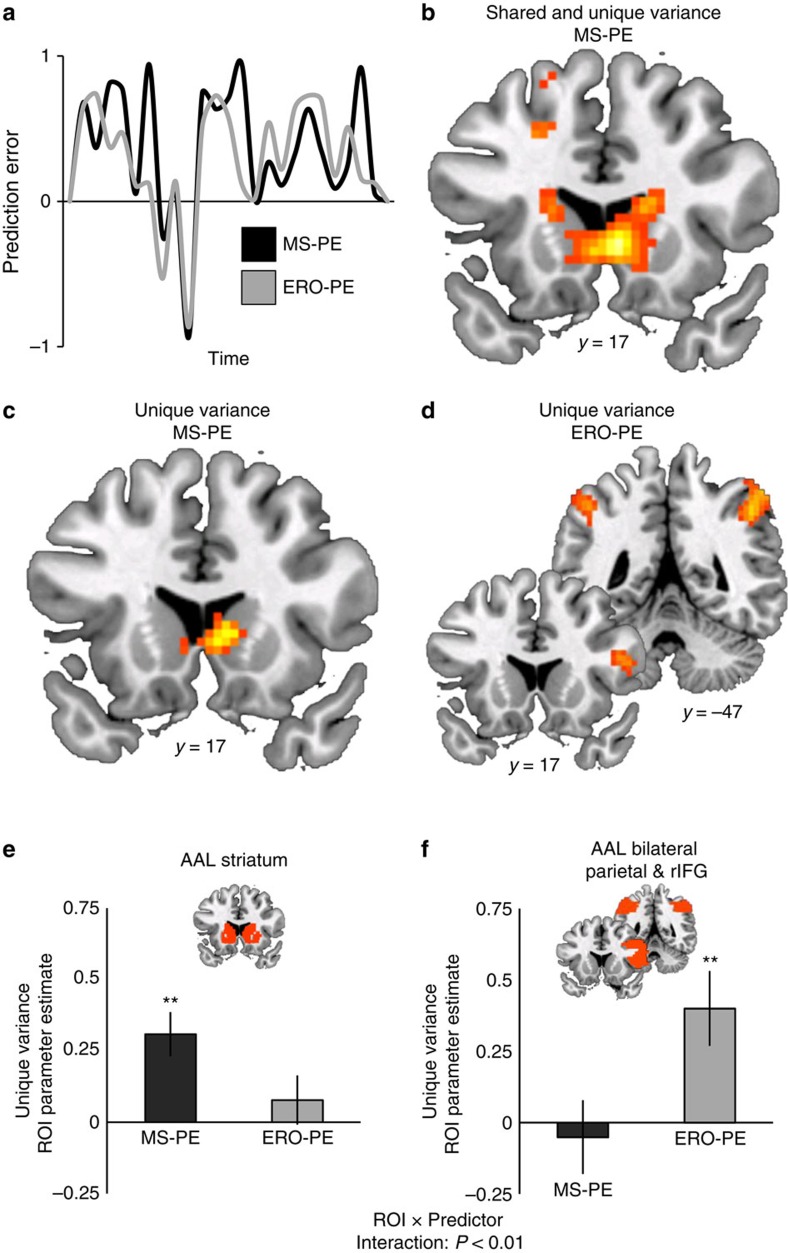
Figure 3. FMRI responses to trial-by-trial PE estimates.
(a) Representative example of fMRI BOLD signal for PEs predicted by the memory strength (MS-PE) and expected response outcome (ERO-PE) alternatives. The cartoon signal displayed here represents the predicted BOLD signal over the course of 10 trials. The two alternatives make correlated but dissociable predictions. (b) Striatum tracks the trial-by-trial PE associated with the shared and unique variance of the memory strength alternative. (c,d) When the predictors are restricted to unique variance, MS-PE is coded in striatum and ERO-PE is coded in right inferior frontal gyrus and bilateral inferior parietal cortex. (e,f) Signal extracted from anatomical regions of interest (ROIs; shown inset; see text for definitions) reveal a significant ROI × predictor interaction. Whole-brain statistical maps are thresholded at P<0.05, FDR cluster corrected. Colour maps represent t-statistics with a range from 0 to 8. Parameter estimates are in arbitrary units. Error bars are s.e.m. **P<0.01 versus zero.

