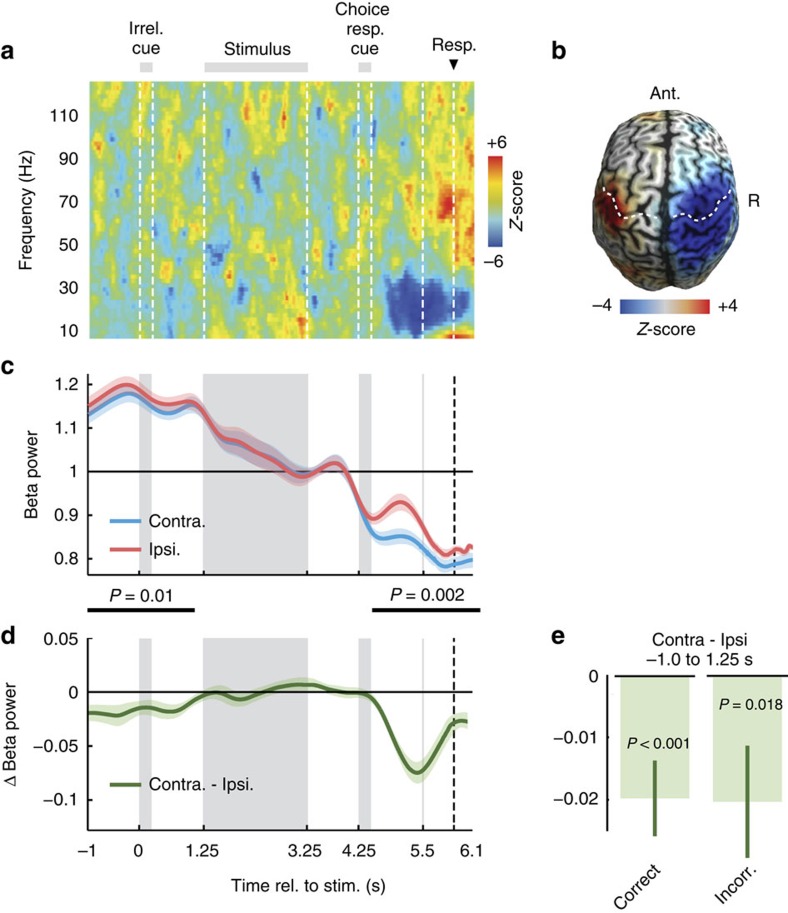
Figure 2. Motor cortex activity predicts upcoming responses.
(a) Time-frequency analysis of the difference of source-reconstructed motor cortex activity contralateral minus ipsilateral to each button-press. Beta power (12–30 Hz) shows a characteristic contralateral suppression before the button-press. Z-scores across subjects (n=20 subjects). (b) Beta power (12–30 Hz) immediately before left minus right button-presses (4.5–5.5 s). Beta power suppression is focused on motor cortex. White dashed lines mark the central sulcus. (c) Time-course of beta power (12–30 Hz) in motor cortex contra- and ipsilateral to the button-press. Activity is normalized by the mean across trials. Shaded areas indicate SEM across participants. Black bars mark significant differences, that is, response-predictive activity (−1.0 to 1.1 s, P=0.01; 4.5–6.6 s, P=0.002; two-tailed one-sample cluster permutation tests, n=20). (d) Time-course of response-predictive beta activity, that is, of the difference in beta power between hemispheres contra- and ipsilateral to the button-press. (e) Difference between contra- and ipsilateral beta power averaged across the prestimulus period (−1 to 1.25 s) is significantly different from 0 in both correct (P<0.001) and incorrect trials (P=0.018, two-tailed one-sample permutation tests, n=20).

