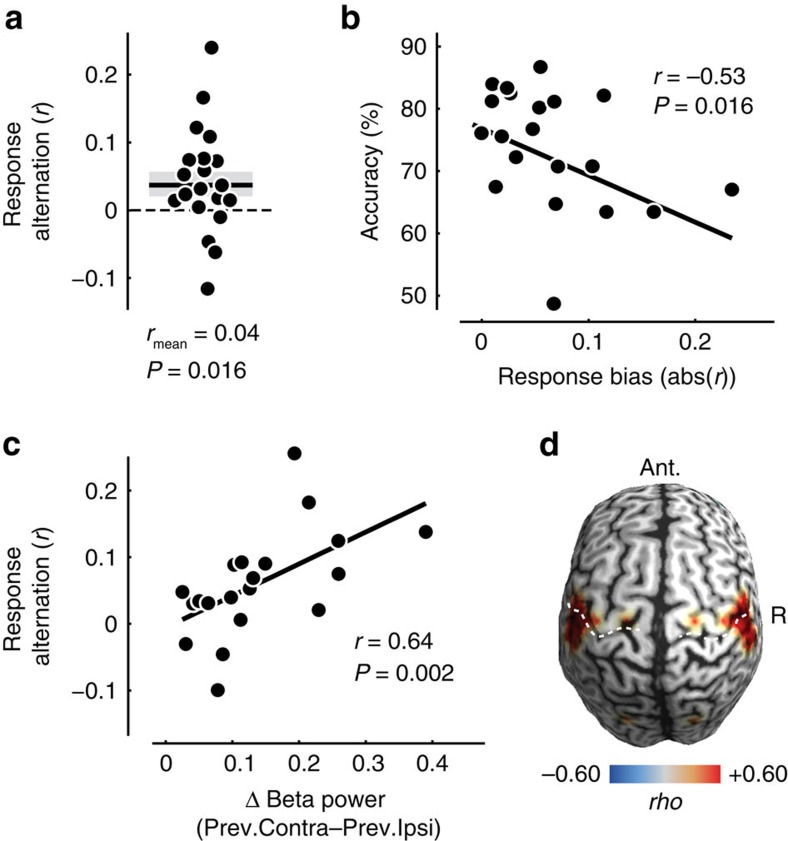
Figure 5. Response alternation and its relation to the beta rebound.
(a) Each participant's tendency to alternate response hands expressed as Pearson's r between opposite hands for consecutive trials. Note that dots are scattered horizontally to avoid overlap. Shaded area denotes SEM. (b) Relationship between response bias and choice accuracy across participants. (c) Relationship between beta rebound (lateralization with respect to previous button-press from −1 to 1.25 s of the current trial) and response alternation across participants. (d) Cortical distribution of the relationship between beta rebound and response alternation across participants. Correlations are masked at P<0.05. Note that the image is symmetric across the midline, because the beta rebound was calculated as the lateralization between corresponding points in both hemispheres.

