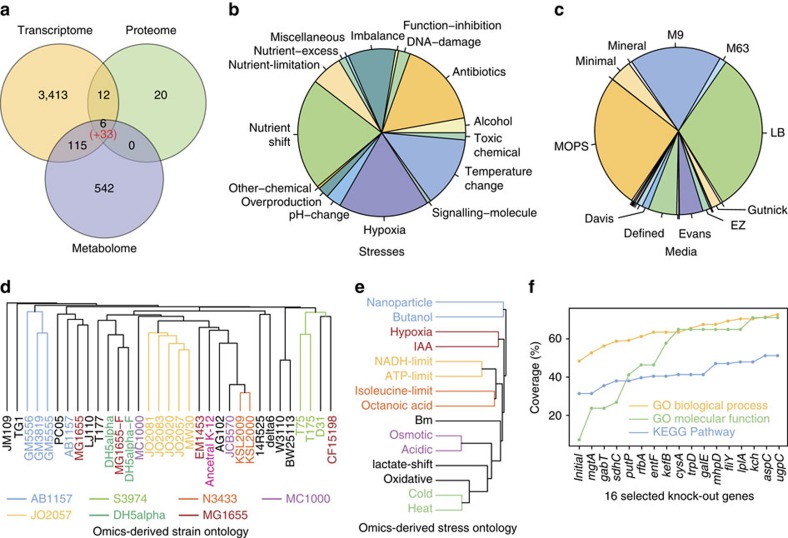
Figure 4. Analysis of the Ecomics compendium.
(a) Number of profiles across the transcriptome, proteome and metabolome layers. The number in parentheses represents the profiles targeted for core metabolism62. (b) Stress distribution in Ecomics. The 52 stresses used in the compendium are grouped into 16 categories. Imbalance refers to the imbalance between production and consumption of reactive species (for example, oxidative, nitrosative). Alcohol represents exposures in alcoholic compounds such as butanol or ethanol. Overproduction refers to the overexpression of macromolecules such as fatty-acid or recombinant protein. Function-inhibition refers to the inhibition of cellular function such as lipid synthesis or peptidoglycan. (c) Media distribution in Ecomics. The 112 media used in the compendium are grouped into 25 basic categories (14 displayed; K, modified complex, BHI, ACSH, TSB, TB, SynH, TPM2, dYT, phosphate, DMA, DMEM, GMM, GGM are not displayed). (d) Strain ontology based on omics profiles. Only transcriptional profiles in LB medium were used. Colour represents strain derivatives. (e) Stress ontology based on omics profiles. Only transcriptional profiles in M9/MOPS media and without stress or genetic perturbation were used. Colour represents common biological processes that are enriched in each stress pair: signal transduction (cyan); central metabolism (red), transport (yellow); cell division (purple); ribosome formation (green). (f) GO coverage enrichment. 16 gene knock-out experiments were iteratively selected based on the number of unrepresented GO terms that were perturbed. Coverage on the y axis is the percentage of functional terms represented in the compendium. The ‘initial' point on the x axis indicates the Ecomics GO coverage before enrichment.

