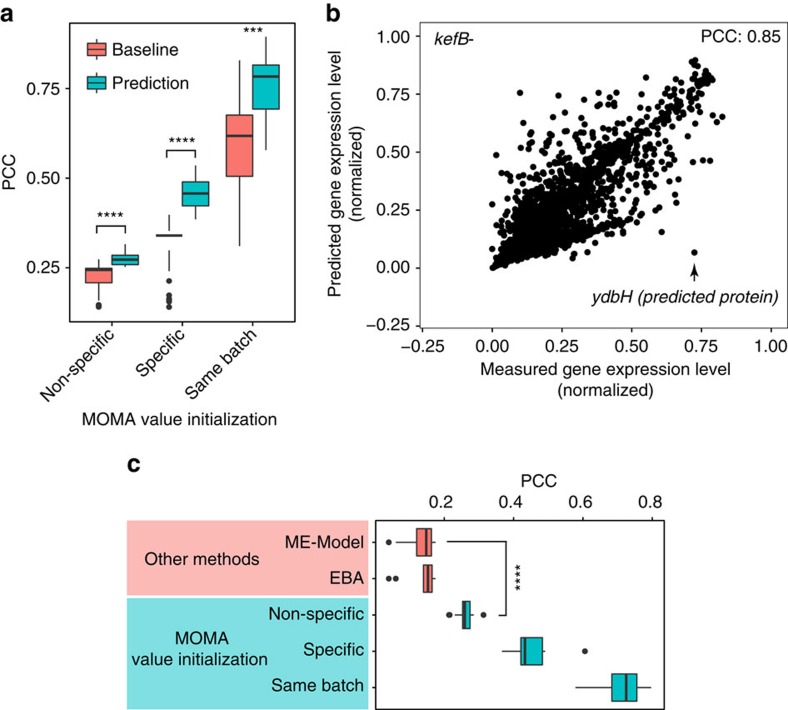
Figure 6. Model validation for 16 novel knockouts in transcriptome prediction and performance comparison with other methods.
(a) PCC between predicted and measured expressed levels of 4096 genes for 16 knockout conditions. Three expression value sets were used to initialize the recurrent neural network (RNN). Non-specific initialization corresponds to the case where the RNN was initialized with the values of the most frequent condition in Ecomics, MG1655 cells in M9/LB media (P<10−10). Specific source initialization corresponds to the mean expression profile of BW25113 cells in M9/Glucose in the compendium, which is the same media and strain that was used in the knockouts (P<10−7). Same-batch initialization corresponds to the mean expression genome-wide profiles of BW25113 cells in M9/Glucose that was measured in the same batch with the 16 knockouts (P<10−3). (b) Scatter plot between predicted and measured expression levels for the kefB knockout condition. (c) Method comparison of prediction performance. We compared the prediction performance of transcriptome response to 16 KOs with ME-Model26 (P<10−6 for non-specific, P<10−13 for specific, P<10−16 for same-batch), and EBA5 (P<10−7 for non-specific, P<10−14 for specific, P<10−16 for same-batch). The error bar indicates standard error over the mean. ***(0.001<P<0.01), ****(0.0001<P<0.001). Wilcoxon rank sum test was used for all statistical tests.

