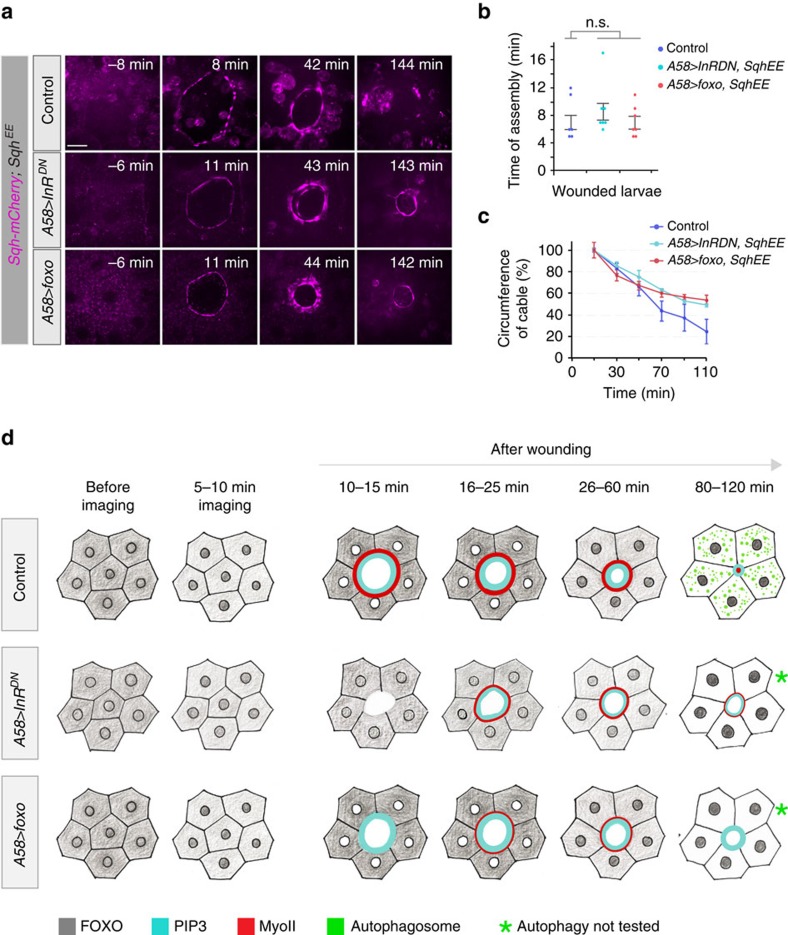
Figure 10. Effect of activated non-muscle myosin II regulatory light chain on the actomyosin cable.
(a–c) Actomyosin cable formation during wound healing in larvae with modified MyoII (Sqh), InR or FOXO activity. These experiments were done in parallel to the experiment in Fig. 9c-e. (a) Time-lapse images of actomyosin cable assembly during wound healing. (b) Average time for initiation of actomyosin cable formation for genotypes shown in a: 7 min for control, 8.5 min for A58>InRDN and 7 min for A58>foxo-GFP. (c) Kinetics of actomyosin cable contractions. Time course of changes in relative cable circumference. Mean±s.e.m. one-way ANOVA with post hoc test, n=3 larvae each genotype indicating non-significant difference in b and c. (d) Cartoon of events after wounding in normal and IIS-compromised epidermis, showing subcellular distribution of FOXO (grey), PIP3 (cyan), MyoII (red) and autophagsomes (green). Autophagy was not tested in A58>InRDN and A58>foxo-GFP (asterisk). Scale bar, (a) 20 μm. Transgene genotypes of larvae: (a–c) Controls (Sqh-mCherry/+; A58-Gal4, SqhE20E21/+) A58>InRDN(Sqh-mCherry/+, UAS-InRDN; A58-Gal4, SqhE20E21/+), A58>foxo (Sqh-mCherry/+, UAS-foxo; A58-Gal4, SqhE20E21/+).

