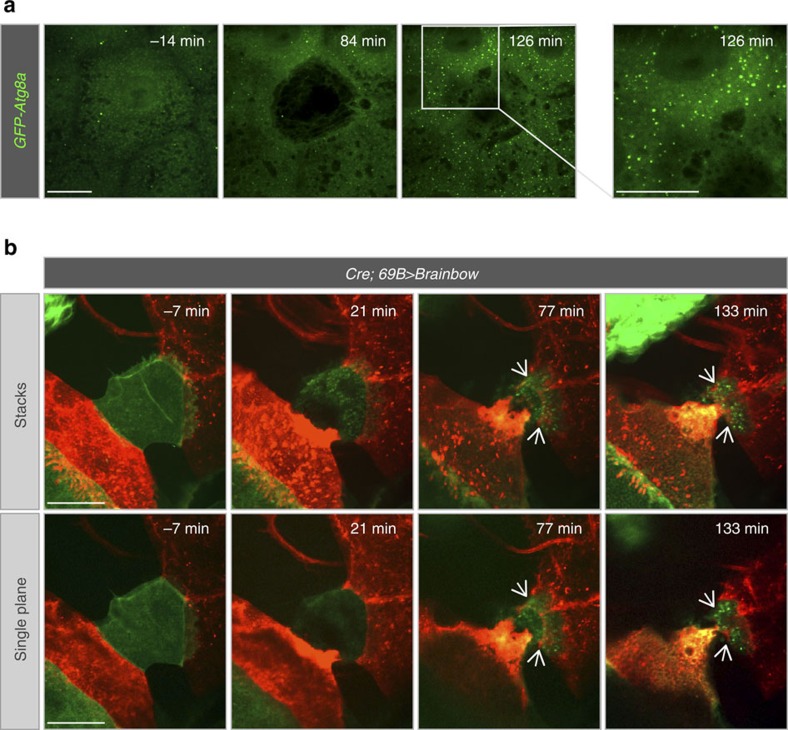
Figure 3. Autophagy during wound closure.
(a) Analysis of autophagy using e22c>GFP-mCherry-Atg8a (only the green channel is shown). Before wounding, the marker was seen in faint particulate structures throughout the cytoplasm. During wound healing the marker redistributed in cells surrounding the wound forming bright spots at later stages. (b) Epithelial cells phagocytose cell debris during wound healing. The Brainbow system was used to mark epidermal cells with different markers (GFP and RFP) by inducing UAS-Brainbow-M in epidermal cells (Cre; 69B>Brainbow-M). In the experiment shown here, a green cell was ablated cell. After wounding the green debris was engulfed (white arrows) by red epidermal cells surrounding the wound. The upper panels are a projection; the lower panels show a single plane to illustrate colocalisation of green and red fluorophores within the engulfing cell. Scale bars, (a) 20 μm, (b stacks and single plane) 30 μm. Transgene genotypes of larvae: e22c>GFP-mCherry-Atg8a (e22c-Gal4, UAS-GFP-mCherry-Atg8a) and 69B>Brainbow-M (Cre; 69B-Gal4,UAS-Brainbow-M).

