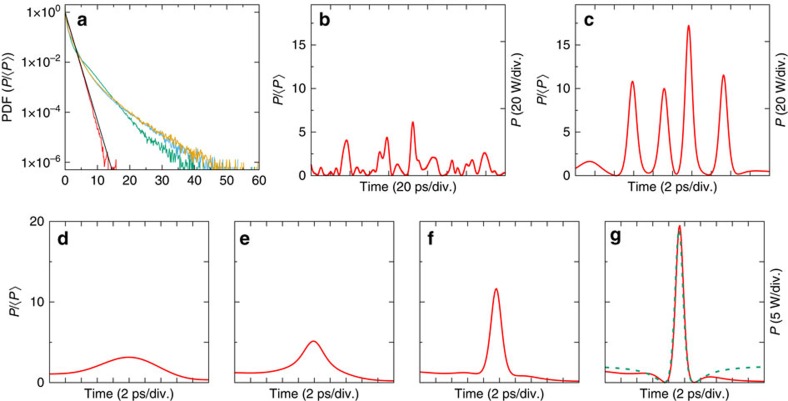
Figure 4. Typical temporal dynamics and statistics (numerical simulations of the 1D-NLSE).
(a) Probability Density Function (PDF) of the initial condition (red line) and of the output power at 500 mW (green line), 2.6 W (yellow line), 4 W (blue line). The black line represents the normalized exponential distribution : PDF(P/〈P〉)=exp(−P/〈P〉). (b) Typical fluctuations of the power of the random field used as initial condition. (c) Series of multiple peaks (zoom) (〈P〉=2.6 W, Δν=0.1 THz). (d–g) Typical snapshots (zoom) showing several stages leading to the emergence of a breather-like structure along the propagation (〈P〉=1 W, Δν=0.05 THz, z=0 m (d), z=285 m (e), z=415 m, (f) z=500 m). The green dashed line in (g) represents the analytical expression of a PS.

