. 2016 Jun 29;4(29):11214–11221. doi: 10.1039/c6ta04840d

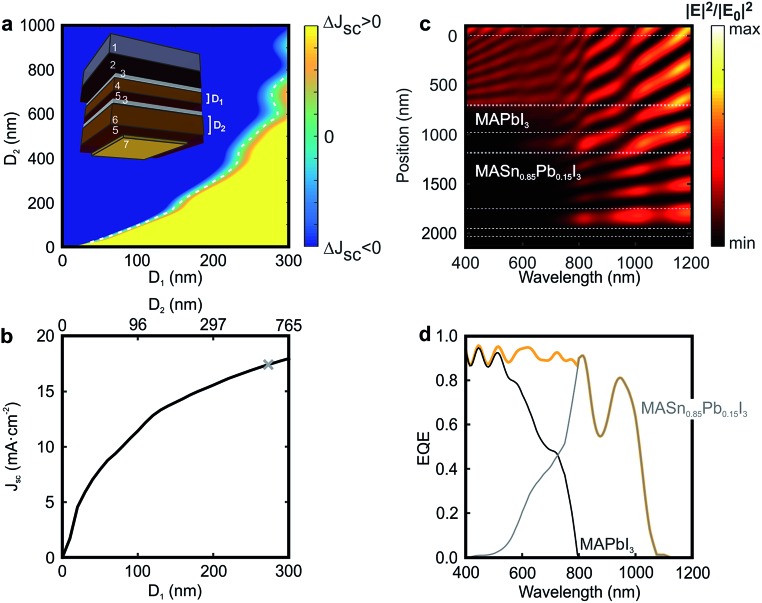
Fig. 4. (a) Difference between short circuit currents extracted from the top and bottom cells composing a tandem device in which the CH3NH3PbI3 (D 1) and CH3NH3Sn0.85Pb0.15I3 (D 2) thicknesses are varied. The white dashed line indicates the thickness pairs for which the current matching is achieved. The inset shows the architecture of the simulated device: 1 mm of glass substrate (1), 650 nm of FTO layer (2), 50 nm of SnO2 compact layer (3), D 1 nm of absorber CH3NH3PbI3 (4), 240 nm of spiro-OMeTAD (5), 50 nm of SnO2 compact layer (3), D 2 nm of absorber CH3NH3Sn0.85Pb0.15I3 (6), 240 nm of spiro-OMeTAD (5) and 50 nm of gold contact (7). (b) Matched short circuit current values for each pair of D 1D 2 thicknesses. The grey mark points out the configuration that is more deeply analysed in the next panels, in which D 1 = 270 nm and D 2 = 560 nm. (c) Calculated spatial (y-axis) and spectral (x-axis) distribution of the electric field intensity enhancement along the cross-section of the selected perovskite-on-perovskite tandem solar cell. White dashed lines specify the interfaces between the different layers. (d) Calculated external quantum efficiency corresponding to the top (black line) and bottom (grey line) cells. The orange line corresponds to the total external quantum efficiency for the complete tandem device.

Fig. 4