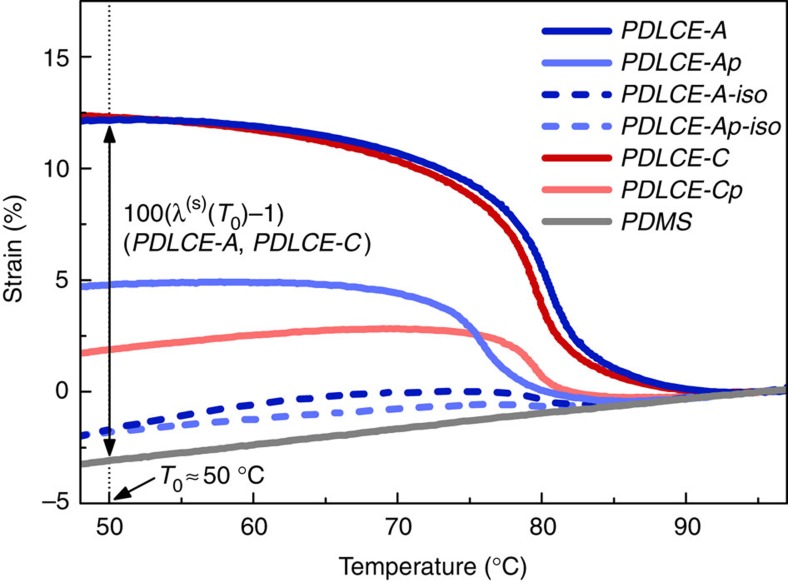
Figure 2. PDLCE thermomechanical response curves.
Experimental λ(T)=L(T)/L(Tref) profiles for PDLCE composites listed in Table 2 are shown as percent strain 100(λ−1). The reference temperature Tref is 95 °C. Specimens with Q>0 (solid lines) clearly display expansion on decreasing temperature, with strain anomalies at Tλ≈80 °C reminiscent of pure monodomain LCEs. Low-temperature strains λ(T0) span from at least several per cent for partially aligned samples (Q<1) to about 12.5%, equivalently λ=1.125, for the best-performing PDLCE-A and PDLCE-C in which μLCE particles are fully aligned (Q→1). On the other hand, isotropic PDLCEs (Q=0, dashed lines, suffix ‘-iso') only display a small residual anomaly at Tλ and contraction on decreasing temperature, with λ(T0)≈0.98. Compensated for the conventional linear thermal expansion with coefficient αPDMS (PDMS curve, grey solid line, with λPDMS(T0)≈0.97), the partial thermomechanical response λ(S)(T)=λ(T)−αPDMS(T−Tref) (double arrow line at T0 for PDLCE-A and PDLCE-C), arising from LCE microparticles' nematic order S (see the modelling in Supplementary Note 3), amounts at T0 to a fair λ(S)≈1.16 for PDLCE-A and PDLCE-C, whereas it vanishes (λ(S)≈1.01), as anticipated, for isotropic PDLCEs.

