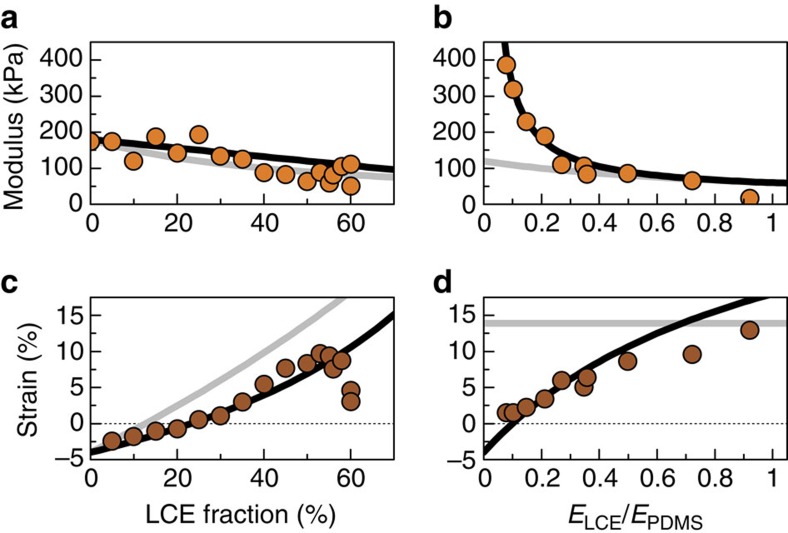
Figure 8. Optimization of properties of PDLCE composites.
Experimental values of E (orange circles) and percentage strain 100(λ(Troom)−1) (brown circles) were measured for PDLCE-A at Troom as functions of LCE material fraction ν (a,c) and its relative elastic modulus y=ELCE/EPDMS (b,d). μLCE-A thermomechanical dopant exhibited λLCE(Troom)=1.45±0.05 strain and ELCE=60±6 kPa Young's modulus. ν-dependence points were obtained with composites prepared with matrix material of Young's modulus EPDMS=180±15 kPa, whereas y-dependence points were obtained by adjusting the PDMS matrix modulus EPDMS via base/hardener composition at a constant ν=0.5, equivalently 50%, LCE fraction. Solid lines show the theoretical predictions from the ‘series' (light grey) and the ‘parallel' (black) model, with evidently favoured ‘parallel' scenario.

