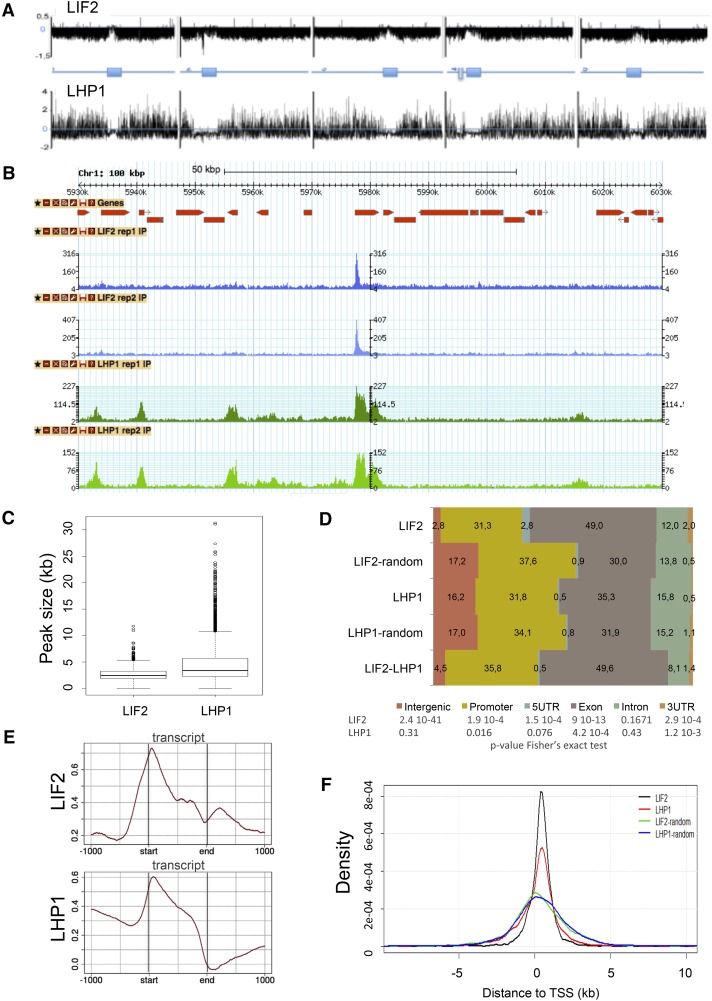
Figure 1.
Genome-Wide Distributions of LIF2 and LHP1.
(A) Chromosomal view of the peaks using model-based analysis.
(B) Screenshot of a 100-kb window with the distributions.
(C) Size distributions of the ERs defined as intersects of MACS peaks for the biological replicates.
(D) Distributions of ER-associated annotations (percentage). Regions with identical sizes were randomly shuffled in the genome and compared with the observed ERs, using a Fisher’s exact test.
(E) Distributions of IP enrichment (log2(# reads IP/# read input)) over the transcript structures.
(F) Distance to closest TSSs of LIF2 and LHP1 ERs, and the corresponding randomized regions.

