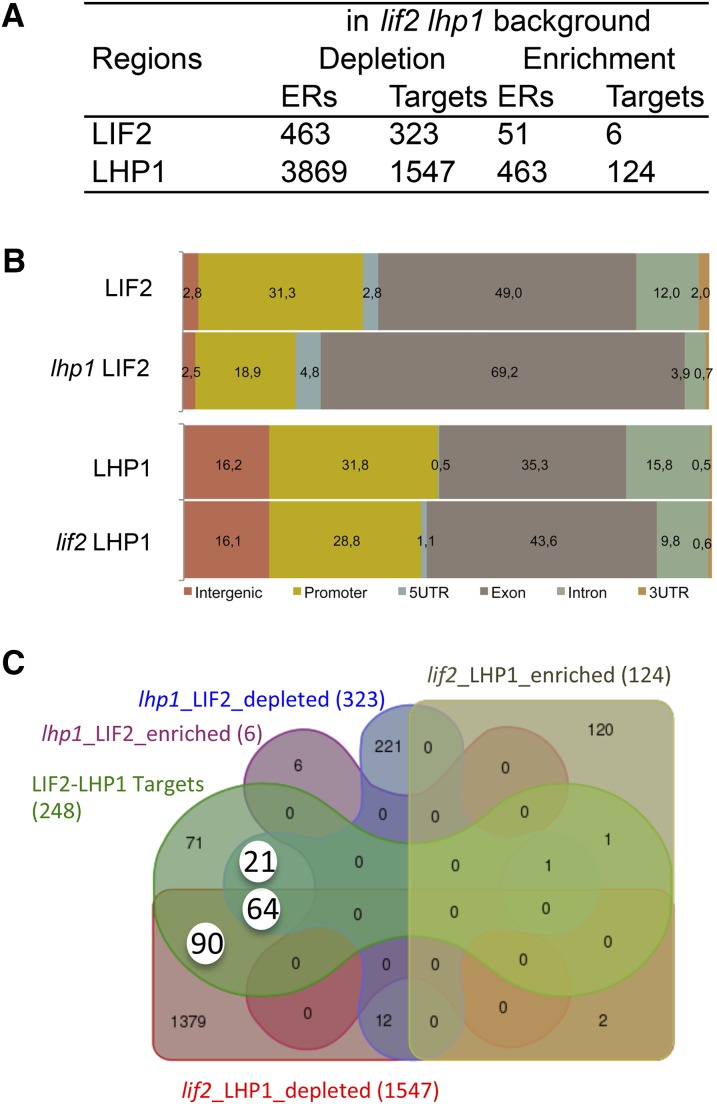
Figure 7.
Complex Interplay between LIF2 and LHP1 for Their Recruitment.
(A) LIF2 and LHP1 binding in the mutant backgrounds.
(B) Distribution of the annotations of the targeted regions.
(C) Venn diagram highlighting Set-21, Set-64, and Set-90 (white circles), which contain LIF2-LHP1 IR genes, depleted in one or the other protein, in the mutant backgrounds.

