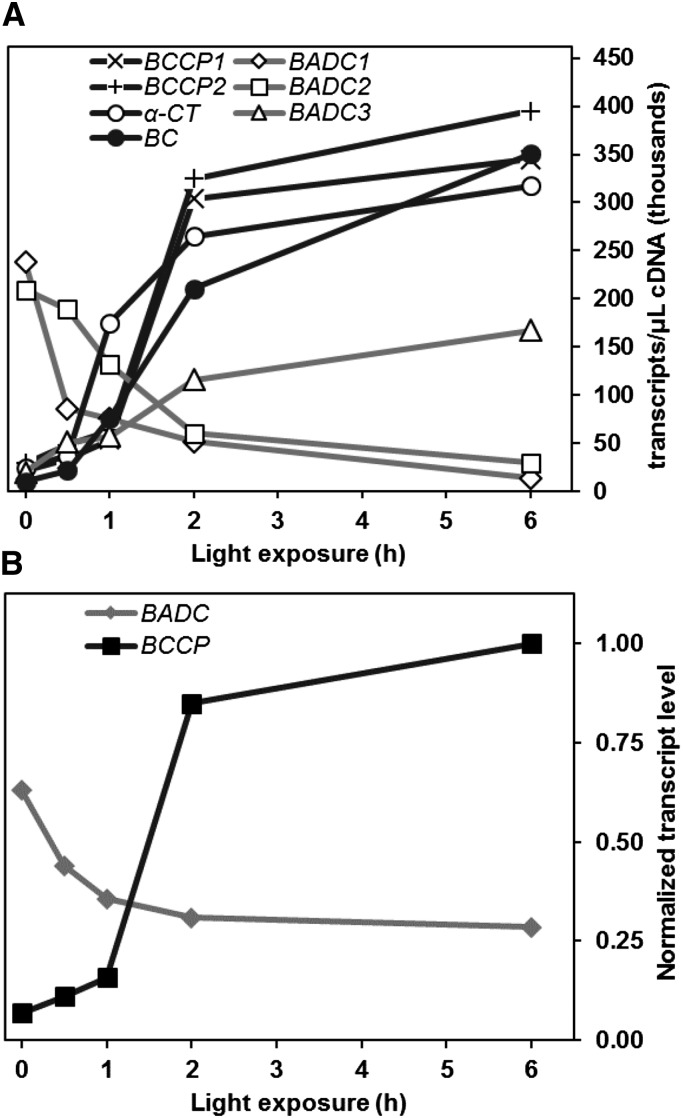
Figure 8.
Light-Dependent Changes in Gene Expression of BADC and hetACCase in Arabidopsis Siliques.
(A) Graph shows the absolute expression level of the given genes obtained by qPCR. Ten-day-old Arabidopsis siliques were collected after various amounts of light exposure. RNA extracted from these tissues was used to create cDNA for this analysis. Average values of four biological replicates are shown, with each replicate containing 10 siliques. Three technical replicates were performed and averaged for each biological replicate. se was ∼5 to 10% for all data points.
(B) Graph depicts the shift in BADC and BCCP total transcript level in response to light. The sum of transcript levels from BCCPs and BADCs in (A) for each time point were normalized to the sum of BCCP transcripts at 6 h light exposure. At T = 0, the ratio of BADC:BCCP transcript is 9:1. At T = 6, the ratio shifts to 1:4.

