Figure 2.
DDB2 and the DNA Demethylation Pathway.
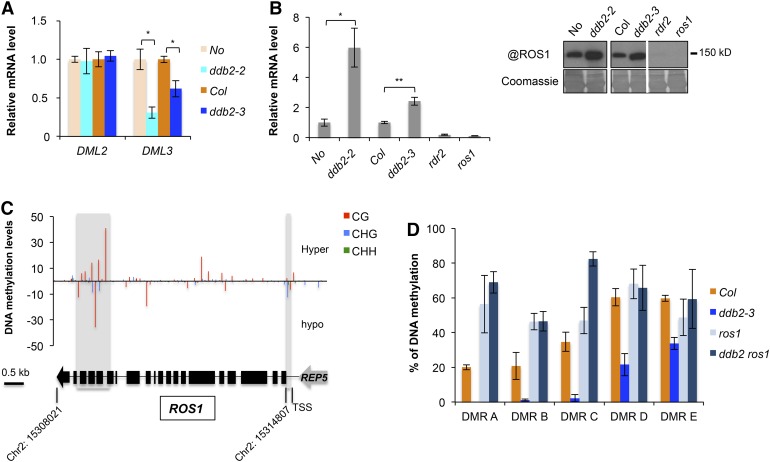
(A) RT-qPCR analysis of transcript levels (±sd) of genes encoding the DNA glycosylases DML2 and DML3, in wild-type (No), ddb2-2, wild-type (Col), and ddb2-3 plants. t test, *P = 1.46 10−3 ;**P = 6.95 10−4; ***P = 2.26 10−3. Data are representative of three biological replicates.
(B) Left panel: RT-qPCR analysis of transcript levels (±sd) of genes encoding the DNA glycosylase ROS1 in wild-type (No), ddb2-2, wild-type (Col), ddb2-3, rdr2, and ros1 plants. t test, *P = 1.31 10−3; **P < 0.01. Data are representative of three biological replicates. Right panel: Immunodetection of the ROS1 protein in wild-type (No), ddb2-2, wild-type (Col), ddb2-3, rdr2, and ros1 plants. Coomassie blue staining of the blot is shown.
(C) Top panel: DNA methylation level for the ROS1 locus in ddb2-3 plants. Regions exhibiting significant changes in DNA methylation levels are shaded. Bottom panel: Schematic representation of the ROS1 locus (Chr2: 15,308,021..15314807). Exons and introns are shown as black boxes and lines, respectively. The REP5 transposon is shown in gray. TSS, transcription start.
(D) Genetic interaction between ddb2 and ros1. Percentage of DNA methylation in Col, ddb2, ros1, and in ddb2 ros1 plants for five hypo-DMRs. Data are presented as percentage of methylation (±sd) determined by McrBC-qPCR and are representative of three biological replicates.

