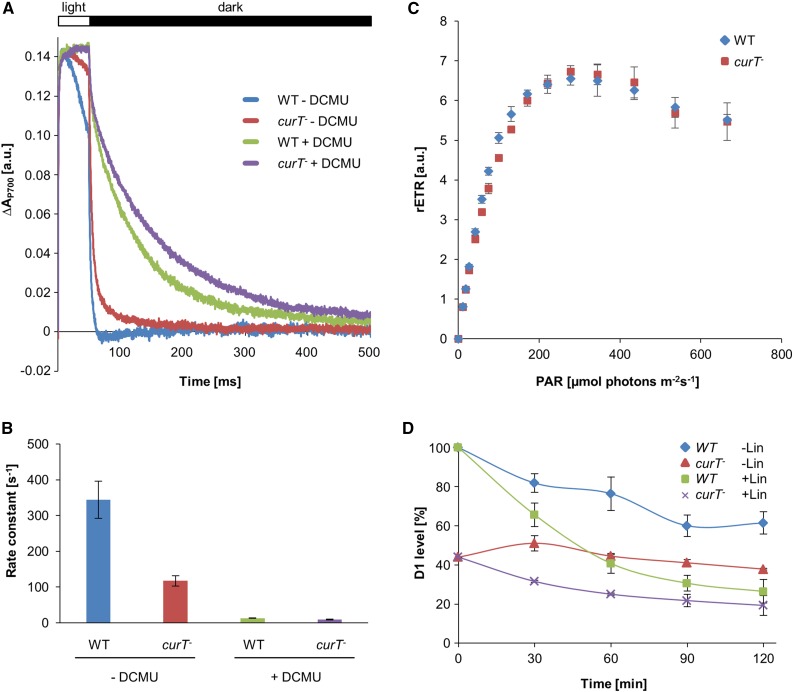
Figure 4.
P700+ Reduction Kinetics and High-Light Effects in curT- Cells.
(A) Averaged traces (10 single measurements) of P700+ decay after complete oxidation by a 50-ms multiple turnover pulse (10,000 µmol photons m−2 s−1) in the absence and presence of 10 µM DCMU.
(B) Rate constants for P700+ reduction were obtained by fitting of the data with single exponential functions. Error bars indicate the sd of three independent measurements.
(C) Impact of light intensity on the (relative) electron transport rate (rETR). Cells were exposed to gradually increasing light intensities, which resulted in increasing electron transport until the capacity limit was reached. PAR: light intensity (µmol photons m−2 s−1). Error bars indicate the sd of three independent measurements.
(D) D1 protein level in the wild type and curT- after high-light treatment (800 µmol photons m−2 s−1) in the presence and absence of lincomycin. Samples were taken every 30 min and processed as in Figure 3 to determine the level of D1 present. 100% refers to wild-type D1 level at the beginning of the experiment.

