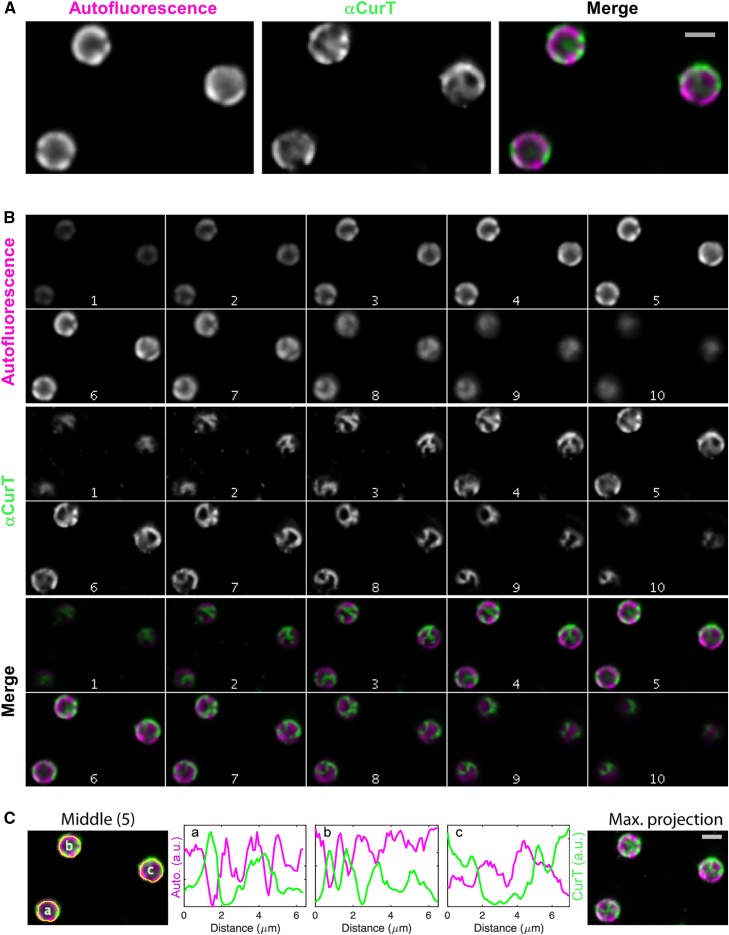
Figure 9.
Immunofluorescence Detection of CurT.
(A) Close-ups of slice 5 in (B).
(B) Wild-type Synechocystis 6803 cells labeled with αCurT antibodies and detected with Oregon Green-conjugated secondary antibodies. The z axis montages are shown as in Figure 8B, except that the step size is 280 nm (1 to 10).
(C) Intensity profiles of the two channels along the autofluorescent peripheral cell “ring” are shown for slice 5. The maximum projection of the entire Z montage is also shown. Bars (light gray) = 2 µm.

