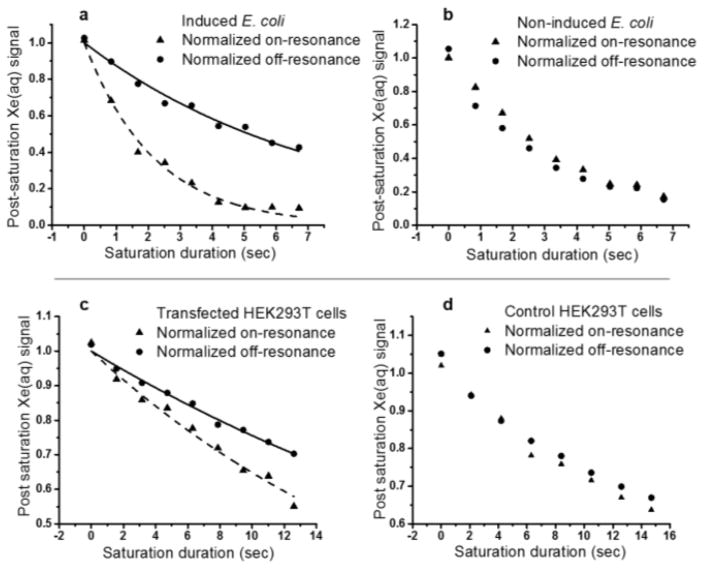
Figure 3.
Top: Time-dependent saturation transfer data for induced E. coli (left) and non-induced E. coli (right). Bottom: Time-dependent saturation transfer data for transfected (left) and control (right) HEK293T/17 cells. Saturation frequencies of Dsnob-shaped pulses were positioned +60 ppm and -60ppm referenced to Xe-aq peak, for on- and off-resonance. Pulse length, τpulse = 1.0496 ms; field strength, B1,max = 279 μT. The number of pulses linearly increased from 0 to 6000, 12000 or 14000.

