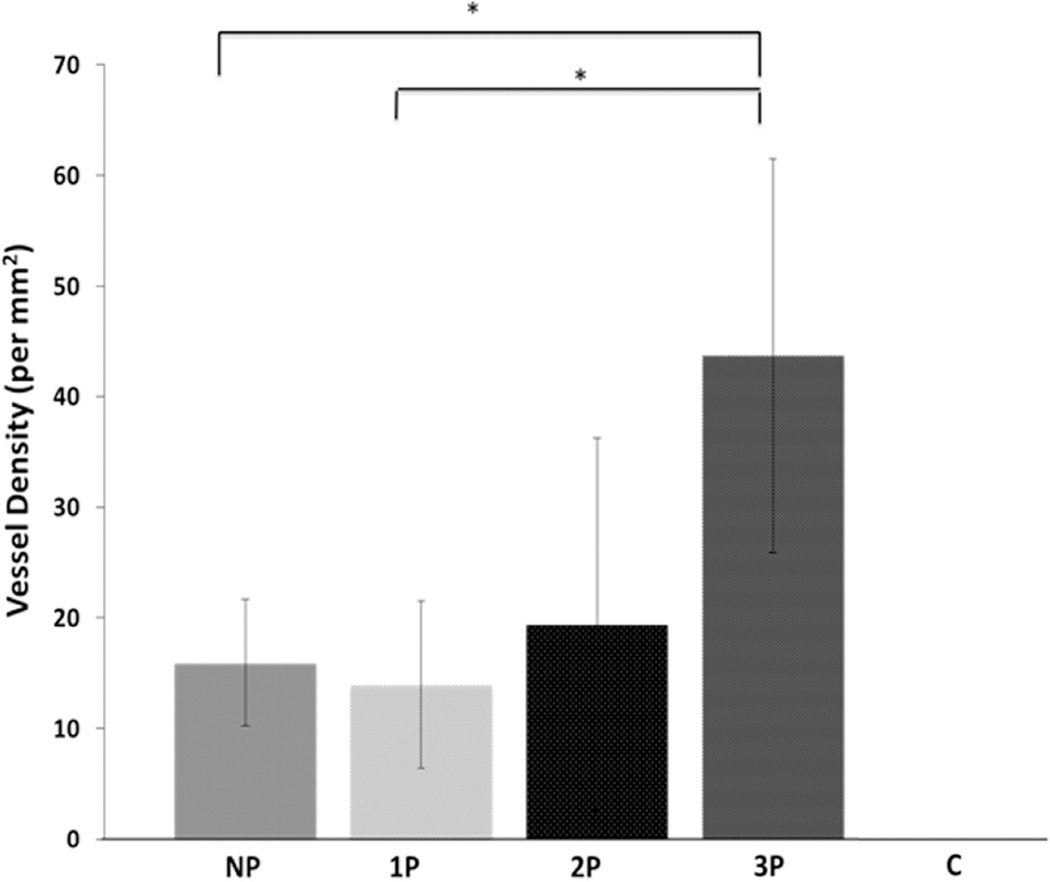
Figure 5.
The plot representing quantification of human CD-31 positive stained vessel density (capillaries/mm2) in control (C), no pre-culture (NP), 1 week pre-culture (1P), 2 week pre-culture (2P) and 3 week pre-culture (3P) groups. The C group has ‘zero’ value indicating absence of any human CD-31 positive stained vessels, therefore, its value cannot be seen on the plot. Amongst NP, 1P, 2P and 3P groups, an increasing trend is observed in the vessel density with the increase of pre-culture time. This increase is statistically significant between NP and 3P groups, and, 1P and 3P groups (*p<0.05).

