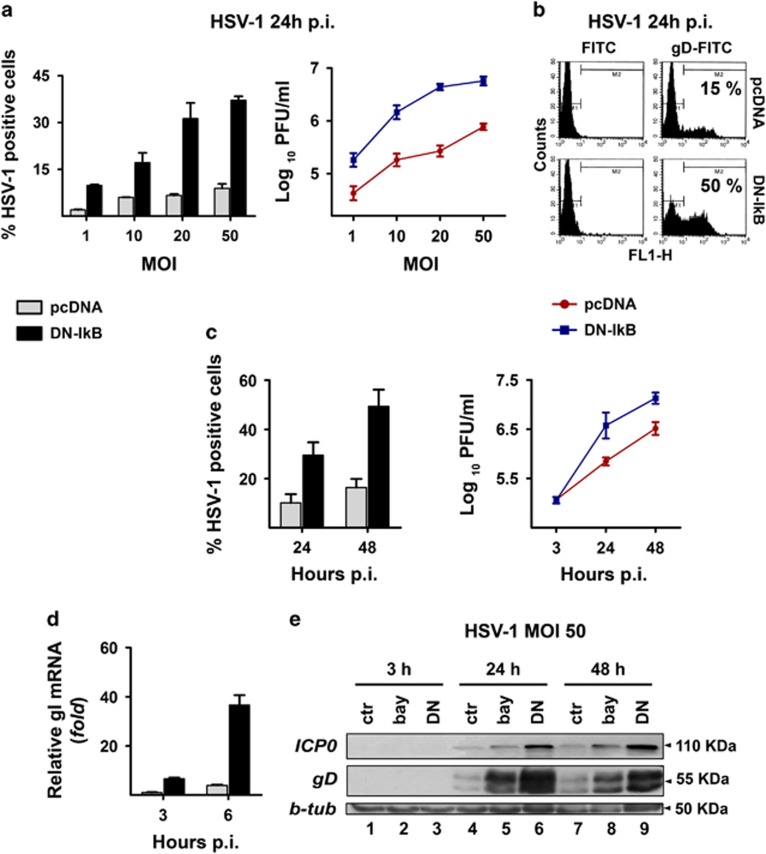
Figure 2.
Rate of HSV-1 replication in the presence or in the absence of NF-κB activation in U937 cells. U937-pcDNA and U937-DN-IκB cells were assayed for virus replication by different techniques. (a) Cells were infected with different MOIs (1-50) of HSV-1 and analysed at 24 h p.i. by indirect immunofluorescence (left panel) using HSV-1 gD-specific antibody or by plaque-forming assay on Vero cells (right panel). Percentage of gD-HSV-1 positive cells was determined by counting 10 different fields under fluorescence microscope. Viral titres are expressed as Log10 PFU/ml in Vero cells of total virus yield from cells infected at the indicated MOI and are depicted in a logarithmic scale (right panel). Data in the left and right panels represent mean values±s.d. from three independent experiments. Left panel, multiple comparisons by Bonferroni's post-hoc ANOVA test gave the following results: pc-DNA versus corresponding DN-IkB groups at all MOI assayed, P<0.001; among the pcDNA groups, MOI 1 versus MOI 50, P=0.002, all other comparisons, not significant; among the DN-IkB groups, MOI 1 versus MOI 10, P=0.001, MOI 20 versus MOI 50, P=0.008, all other comparisons, P<0.001. Right panel, pcDNA versus corresponding DN-IkB groups at all MOI assayed, P<0.001; among the pcDNA groups, MOI 10 versus MOI 20, not significant, MOI 20 versus MOI 50, P=0.002, all other comparisons, P<0.001; among the DN-IkB groups, MOI 10 versus MOI 20, P=0.001, MOI 20 versus MOI 50, not significant, all other comparisons, P<0.001. (b) Cells were infected with HSV-1 at an MOI of 50 and analysed at 24 h p.i. for viral protein expression by flow cytometry using HSV-1 gD-specific antibody. (c) Time dependency of virus replication (MOI 50) assayed as in (a) by immunofluorescence (left panel) or plaque-forming assay (right panel). Data represent the mean values±s.d. from four independent experiments. Left panel, multiple comparisons by Bonferroni's post-hoc ANOVA test gave the following results: pcDNA versus corresponding DN-IkB at all times assayed, P<0.001; t24 versus t48, pcDNA not significant, DN-IkB P<0.001. Right panel, pcDNA versus corresponding DN-IkB, t3 not significant, all other comparisons, P<0.001; among pcDNA and DN-IκB groups at all times assayed, P<0.001. (d) qPCR analysis of mRNA levels for HSV-1 glycoprotein I in pcDNA cells infected at an MOI of 50 at the indicated times. Data obtained from three independent experiments performed in duplicate were normalized to 18 S rRNA. Values are expressed as mean±s.d. fold changes, relative to gI mRNA levels at 3 h p.i. (the lowest detected value). Multiple comparisons by Bonferroni's post-hoc ANOVA test gave the following results: t6 versus all other groups, P<0.001; all other comparisons, not significant. (e) Western blot analysis showing the effects of pharmacological (bay lanes 2, 5 and 8) and biochemical (lanes 3, 6 and 9) inhibition of NF-κB activity on expression of IE ICP0 and late gD viral proteins. Whole cell lysates were prepared from HSV-infected (50 MOIs) U937-DN-IκB cells and pcDNA cells, pretreated (bay) or not (ctr) with 1 μM BAY-117085 for 16 h. β-tubulin was used as loading control

