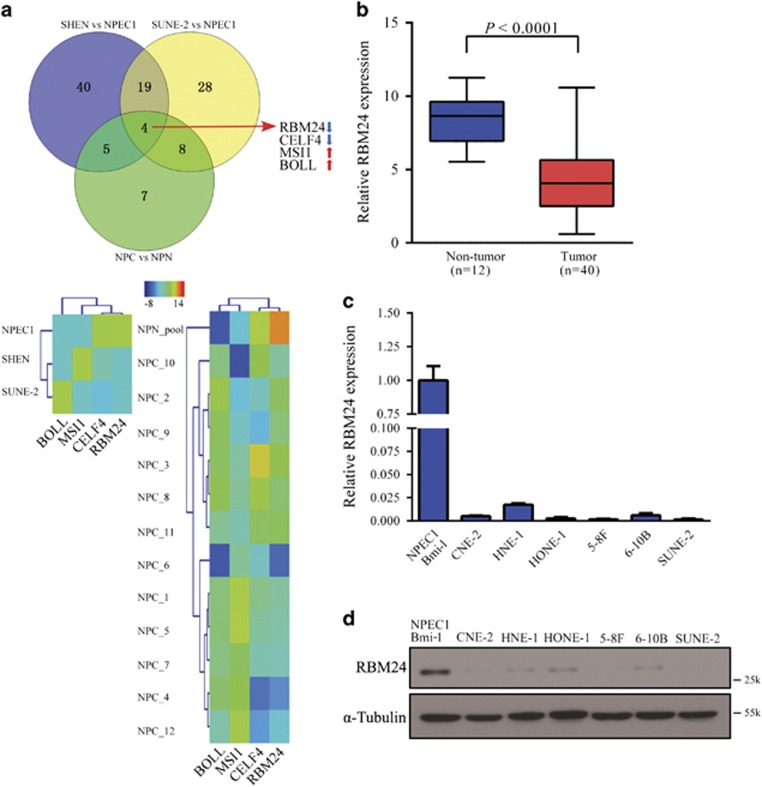
Figure 1.
The downregulation of RBM24 in NPC. (a) Upper: Venn diagram showing the overlap of RBP genes with different expression levels in NPC cells and tumor samples. Lower: Hierarchical clustering of gene RPKMs of four RBP-encoding genes across NPEC1, NPC cells and patient samples. (b) qRT-PCR showing the relative RBM24 expression levels in 40 NPC samples versus 12 non-cancerous nasopharyngeal tissue samples. (c and d) The relative RBM24 mRNA and protein levels in NPC cells, as determined by qRT-PCR and immunoblotting, respectively. The error bars represent the mean±S.E.M. from three independent experiments

