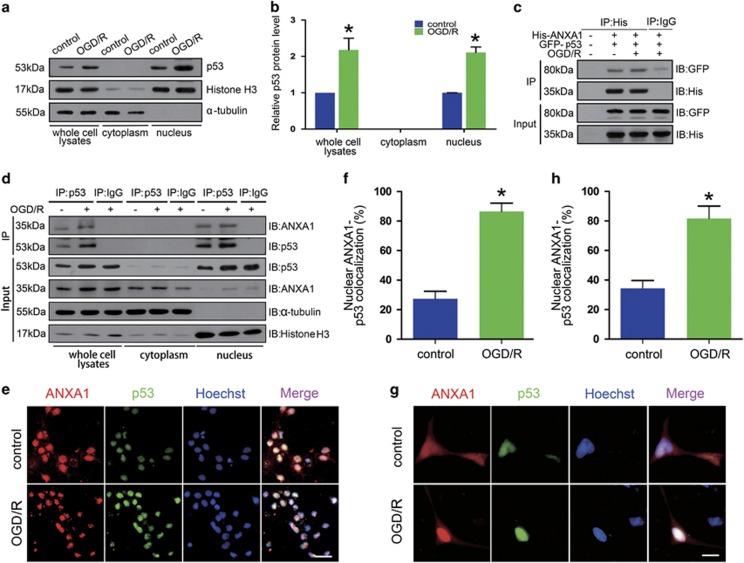
Figure 4.
ANXA1 interacts with p53 in the nucleus after OGD/R. (a) Western blot results demonstrating the expression of p53 in the cytoplasm and nucleus in primary cultured neurons treated without or with OGD/R. (b) Quantitative densitometry analysis of the p53 expression shown in (a). The data are expressed as the means±S.E.M. from three independent experiments. *P<0.05 versus control. (c) Representative Co-IP results show the interactions of ANXA1 with p53 in HEK293 cells transfected with pcDNA-ANXA1 (His-tagged) and pEGFP-p53 (GFP-tagged) treated without or with OGD/R. (d) Representative Co-IP results show the interactions of ANXA1 with p53 in primary cultured neurons treated without or with OGD/R. (e) Immunofluorescence shows the colocalization of endogenous p53 and ANXA1 in primary cultured neurons treated with or without OGD/R. Scale bar=50 μm. (f) The nuclear colocalization of endogenous ANXA1 and p53 was quantitated as a graph. The data are expressed as the means±S.E.M. from three independent experiments. *P<0.05 versus control. (g) Immunofluorescence shows the colocalization of ANXA1 and p53 in HEK293 cells transfected with pjRed-ANXA1 and pEGFP-p53 treated with or without OGD/R. Scale bar=50 μm. (h) The nuclear colocalization of endogenous ANXA1 and p53 was quantitated as a graph. The data are expressed as the means±S.E.M. from three independent experiments. *P<0.05 versus control

