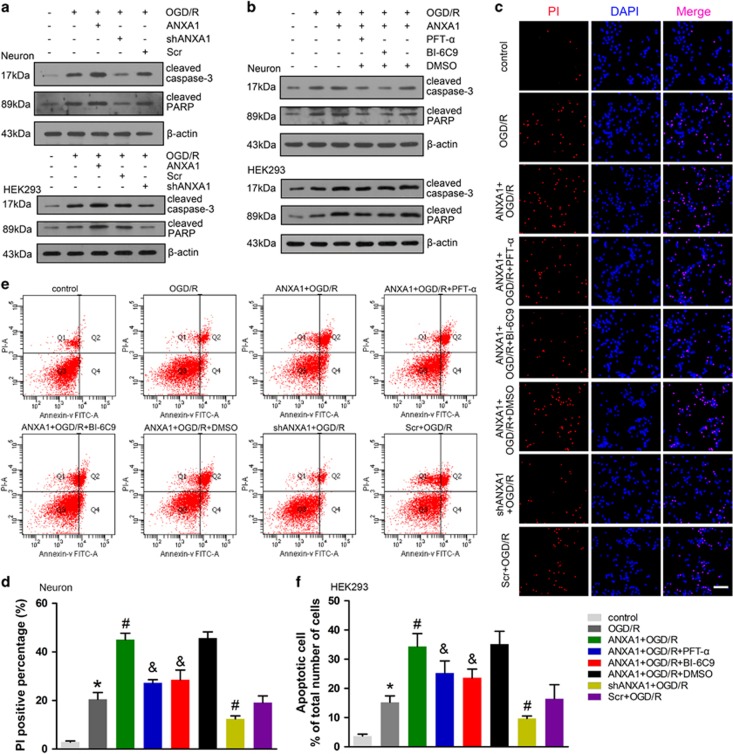
Figure 7.
Effect of ANXA1 on the caspase-3 apoptotic pathway. (a) Western blot showing the expression of cleaved caspase-3 and PARP following treatment with ANXA1 or ANXA1 shRNA in neuronal cells and HEK293 cells. The results were obtained in three independent experiments. (b) Western blot showing the expression of cleaved caspase-3 and PARP following treatment with ANXA1, PFT-α, or BI-6C9 in primary cultured neurons or HEK293 cells. The results were obtained in three independent experiments. (c) PI staining results demonstrating cell death following treatment with ANXA1, PFT-α, BI-6C9, or ANXA1 shRNA in primary cultured neurons. Scale bar=50 μm. (d) Statistical analysis of the data shown in (c). The data are expressed as the means±S.E.M. from three independent experiments. *P<0.05 versus control, #P<0.05 versus OGD/R and &P<0.05 versus ANXA1+OGD/R. (e) Flow cytometry results demonstrating apoptosis following treatment with ANXA1, PFT-α, BI-6C9, or ANXA1 shRNA in HEK293 cells. (f) Statistical analysis of the data shown in (e). The data are expressed as the means±S.E.M. from three independent experiments. *P<0.05 versus control, #P<0.05 versus OGD/R and &P<0.05 versus ANXA1+OGD/R

