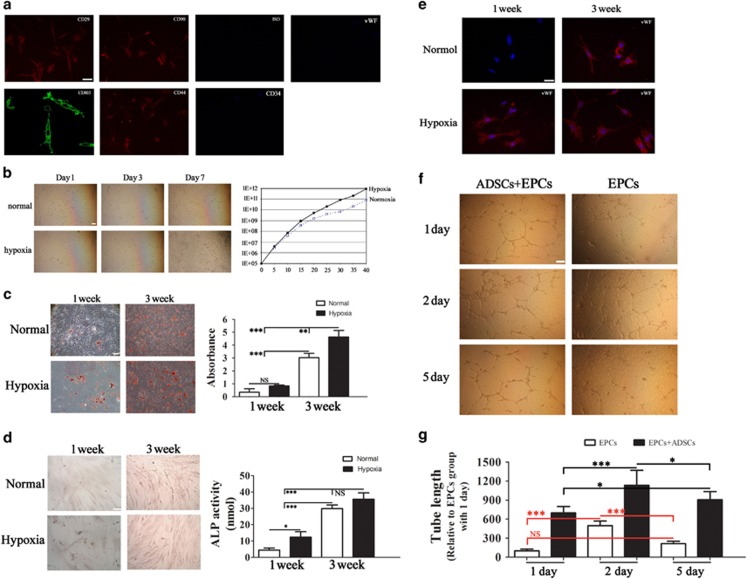
Figure 4.
Characteristics of ADSCs and the effect of low oxygen tension on multipotent differentiation potential. (a) Detection of cell surface markers by immunofluorescence staining with antibodies against CD29, CD90, CD44, CD105, CD34 and vWF labeled with FITC (green color) or phycoerythrin (PE) (red color). A negative FITC and PE labeled mouse IgG isotype control was included (magnification: × 200). Scale bar: 5 μm. (b) Phase contrast images of ADSCs showing morphological changes relative to the duration of the culture, and graph showing the growth of ADSCs under hypoxic and normoxic conditions over a period of 40 days (magnification, × 200). Scale bar: 20 μm. (c and d) The differentiation potential of ADSCs was assessed by Oil-red-O (c) and alkaline phosphatase (ALP) (d) staining at 1 and 3 weeks after culture in adipogenic or osteogenic induction media, respectively, under hypoxic or normoxic conditions (magnification, × 400). Scale bar: 20 μm. Quantitative analysis of fat drops extracted with isopropanol was performed with the Lipid Assay Kit and measurement of specific absorbance. Values represent the mean (S.E.) of three experiments. ALP activity was measured with an ALP activity assay. (e) The endothelial differentiation potential of ADSCs was analyzed by immunofluorescence detection of vWF in cells cultured under normoxia or hypoxia in endothelial differentiation media (magnification, × 400). Scale bar: 5 μm. (f) Tube formation in EPCs treated with or without ADSCs at a ratio of 1 : 1 and cultured in serum-free endothelial basal medium (EBM) under conditions of hypoxia (magnification, × 200). Scale bar: 20 μm. (g) The length of formed tubes was quantified by densitometry. The EPC group treated for 1 day was used as a positive control (n=6). *P<0.05, **P<0.01, ***P<0.001. NS, no significant difference

