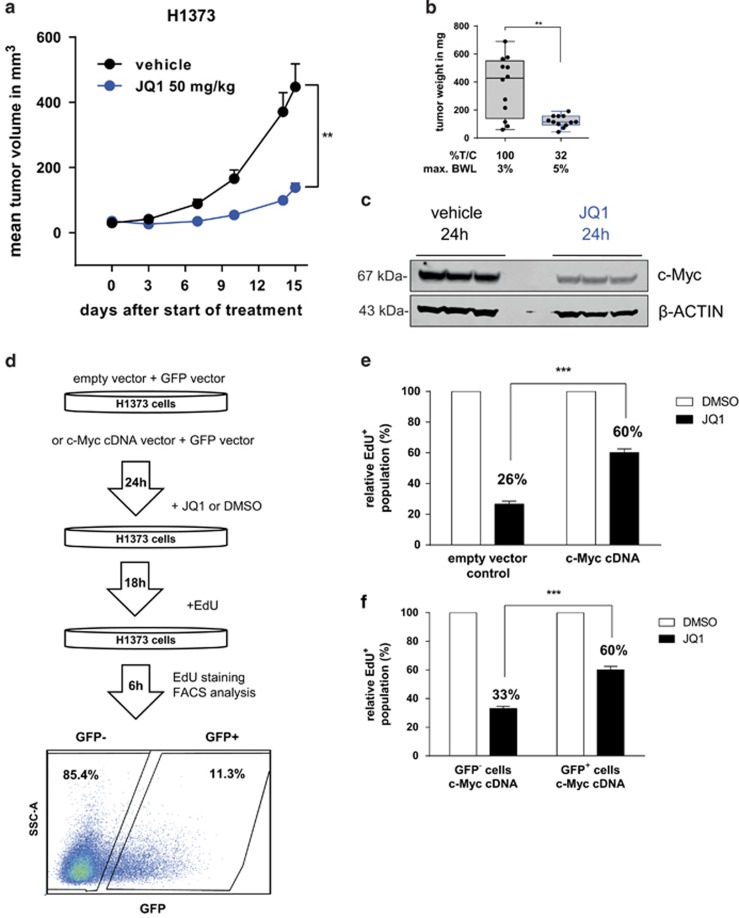
Figure 3.
(a) Growth curve of H1373 xenograft treated with vehicle or 50 mg/kg JQ1 i.p. daily. Error bars denote S.E.M. (n=12 mice per group) **P<0.01 two-tailed unpaired Student's t-test on log transformed tumor volume on day 15 after start of treatment. (b) Box and whiskers plot of tumor weight in the H1373 xenograft study on day 15 after start of treatment. Error bars denote S.E.M. (n=12 mice per group). **P<0.01 two-tailed unpaired Student's t-test on log transformed tumor weight. (c) Western blot analysis c-Myc level in tumor tissue from the H1373 xenograft study treated with vehicle or 50 mg/kg JQ1. (d) Workflow of rescue experiment in H1373. Cells were transfected with empty vector or c-Myc expressing vector and GFP vector, and then subsequently treated with JQ1 (0.5 μM) or DMSO and stained using EdU. (e and f) Results of overexpression rescue experiments comparing empty vector versus c-Myc vector transfected cells (e) and GFP− versus GFP+ cells co-expressing c-Myc (f) EdU+ population was normalized to DMSO-treated control sample. Error bars denote S.E.M. (n=3). ***P<0.001 two-tailed unpaired Student's t-test

