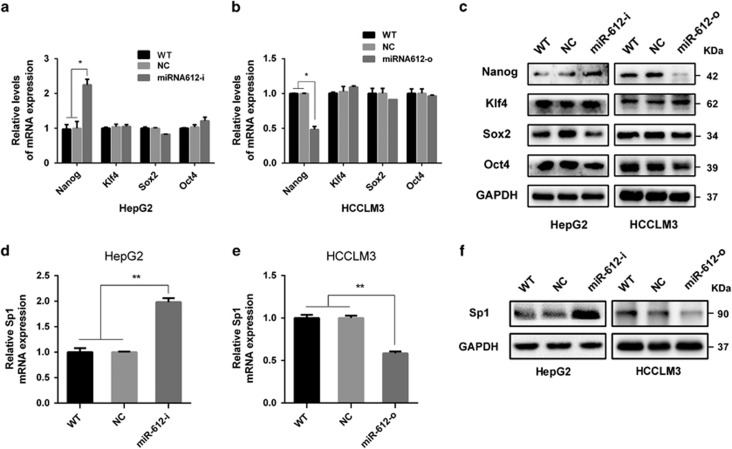
Figure 2.
The mRNA and protein levels of transcription factor and Sp1 in HepG2, HCCLM3 with miR-6120-i, miR-612-o, respectively. (a and b) qRT-PCR. (c) Western blot analysis of Nanog, Klf4, Sox2 and Oct4 in miR-612-o HCCLM3 and miR-612-i HepG2 cells, respectively. (d and e) qRT-PCR. (f) Western blot analysis of Sp1 after indicated treatments, respectively. Statistical analysis by Student's t-test (*P<0.05, **P<0.01)

