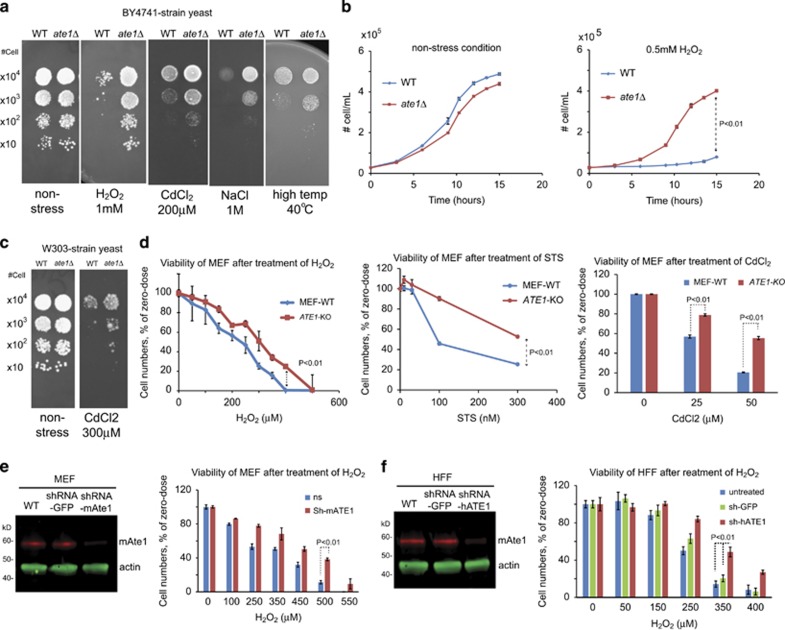
Figure 1.
Knockout or knockdown of ATE1 decreases cellular sensitivity towards stressing conditions. (a) Growth test using serial dilutions of wild-type (WT) and ate1Δ yeast (S. cerevisae, BY4741 strain, unless otherwise mentioned) in non-stressing condition or in the presence of one of the following stressors: common cellular oxidant (H2O2, 1 mM), heavy metal (CdCl2, 200 μM), high salt (NaCl, 1 M) or high temperature (40 °C). For H2O2 treatment, cells were plated on SD plates with glucose. For the other treatments and the non-stressing controls, cells were plated on YPD plates. (b) Growth curves of WT and ate1Δ yeast cultured in liquid media, in the presence or absence of the oxidative stressor H2O2. Error bars represent S.D., n=3. (c) Growth test using WT or ate1Δ yeast (strain W303) in non-stressed conditions or in the presence of the heavy metal CdCl2 (300 μM). (d) Viabilities of WT or ATE1-KO mouse embryonic fibroblasts (MEFs) after 12 h treatments with increasing concentrations of cellular oxidant H2O2, bacterial toxin STS or heavy metal CdCl2. The number of viable cells after H2O2 treatment was measured by Calcein AM, a cellular dye that emits fluorescence only in live cells. The number of viable cells after STS and CdCl2 treatments was directly counted with an automated cell counter (TC-20 from Bio-Rad) with the cross-staining of Trypan blue, which stains dead cell but not live cells. In each type of cell, one sample of cells with control treatment (DMSO only) was used as normalization for other samples, for WT or ATE1-KO, respectively. Error bar represents S.E.M. of multiple repeats (n=4 for H2O2 and STS, and n=3 for Cdcl2). (e) Immunoblot analysis of the steady-state levels of mammalian Ate1 (mAte1) in MEF transfected with either shRNA specific against mouse ATE1 (sh-mATE1) or shRNA against GFP (used as a non-targeting control). The band of mAte1 was probed with a monoclonal antibody (Millipore, clone #6F11) recognizing all four major splicing variants of Ate1 in mammalian cells, which are almost identical in molecular sizes and poorly understood in functional differences. Actin was used as a loading control. The right panel graph shows the quantification of viability of MEFs transfected with Ate1 knockdown or non-targeting control, after the treatment with H2O2 for 12 h, as measured by the cellular viability indicator Calcein AM. Error bars represent S.E.M. (n=4). (f) Similar to e, except that human foreskin fibroblast (HFF) and shRNA against human ATE1 (sh-hATE1) were used. Error bars represent SEM (n=4). Throughout this study, the P-value was calculated by two-tailed Student's t-test between specific data points, unless otherwise indicated

