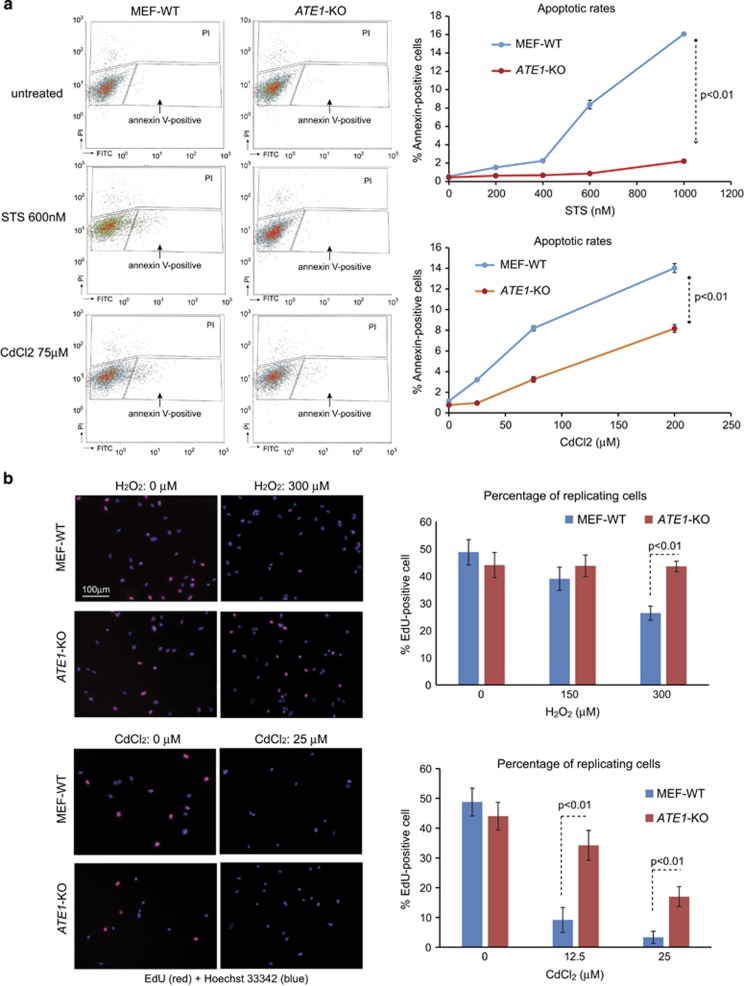
Figure 3.
Knockout of ATE1 in MEFs results in attenuated apoptosis and growth arrest during stress response. (a) Annexin-V-Alexa Fluor 488 (Thermo Fisher) was used to detect phosphatidylserine inversion on the peripheral membrane in an early stage of apoptosis. WT or ATE1-KO MEFs were treated with STS or CdCl2 of different concentrations for 5 h. Propidium iodide (PI) was used to label necrotic and late apoptotic fractions. The cell population is analyzed by FACS. On the left panel representative FACS charts are shown. The gate settings for Annexin-V and PI detection are indicated. Quantification of data from three independent repeats (n=3) are shown in graphs presented on the right side. ATE1-KO cells have a much lower apoptotic rate than WT cells. No obvious difference in PI staining was found in the conditions we tested. (b) On the left panel are the representative microscopic images showing WT and ATE1-KO MEFs treated with H2O2 0.5 mM. EdU (red fluorescently labeled), which is incorporated into newly synthesized DNA during the S phase of cell cycle, was used as a marker for cell proliferation. Hoechst 33342 (blue) was used to show the number and morphology of nucleus. Only cells with normal nuclear morphology and no sign of apoptotic bodies were included for quantification. At least 10 randomly chosen images in each group were used to generate the graphs shown on the right side for quantification of active replicating cells with EdU incorporated into their nucleus, in the presence of stressors H2O2 and CdCl2. Error bars represent S.E.M.

