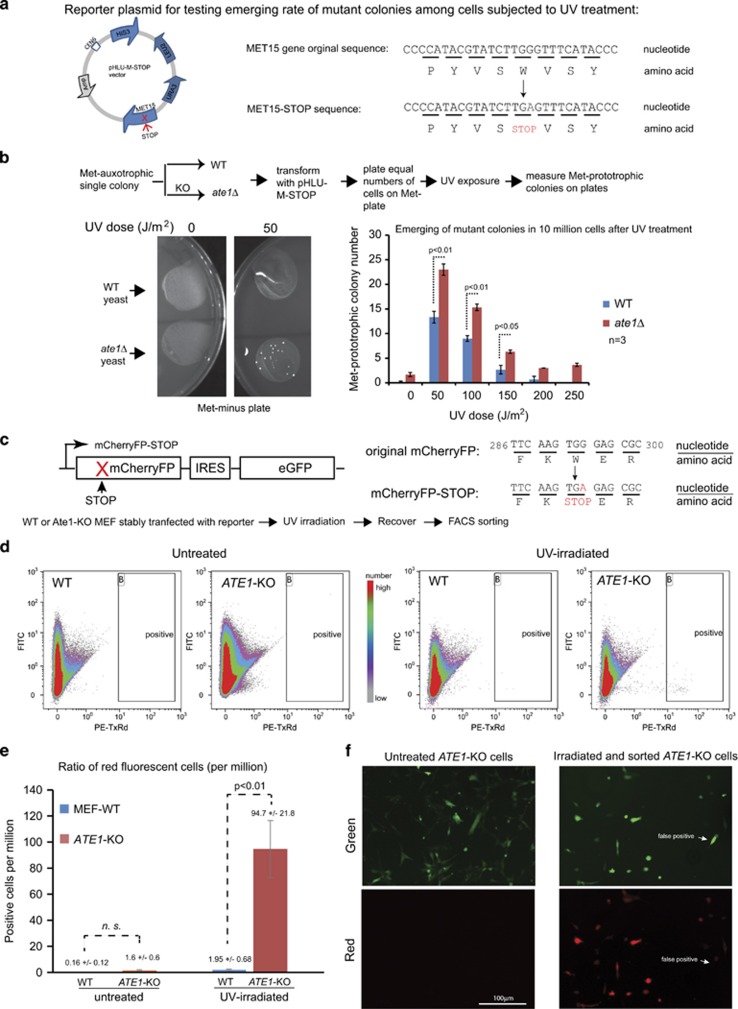
Figure 8.
Knockout of ATE1 increases mutagenesis upon UV irradiation. (a) Scheme showing the construction of a mutagenesis reporter plasmid. On the left is the vector map of the pHLUM-stop plasmid, which contains three auxotrophic marker genes: HIS3, LEU2, URA3 and a mutated MET15 gene with a stop codon in the middle of its coding sequence. The scheme on the right shows a portion of the coding sequences and corresponding amino acids in the original MET15 gene and the mutated Met15 stop gene, where a TGG codon, coding for tryptophan (W), is converted to a TGA stop codon. (b) The top panel shows a flow chart describing the procedure followed to create isogenic pairs of WT and ate1Δ yeast and for testing emergence of Met-prototrophic mutant colonies on Met-minus plates starting with the same number of cells for UV irradiation. The bottom left panel has representative images showing the auxotrophic colonies emerged from 20 million yeast (in each spreading) without or with a low dose of UV exposure (50 J/m2). The graph on the bottom right is the quantification of the experiment on the left for all tested doses of UV irradiations. Error bar represents S.E.M. (n=3, except for the control non-irradiated groups where n=6). (c) Scheme showing the construction of a mammalian mutagenesis reporter, mCherryFP–STOP–IRES–GFP, which was modified from the pQC-XIG retroviral vector suitable for stable transfection. A STOP codon is inserted in the N-terminal region of the mCherryFP-coding region so that this protein cannot be expressed as full-length, unless an acquired mutation reverts it to a sense codon (revertant). The scheme on the right shows a portion of the coding sequences and corresponding amino acids in the original mCherryFP gene and the mutated mCherryFP–STOP gene, where a TGG codon, coding for tryptophan (W), is converted to a TGA stop codon. (d) Representative FACS charts showing the distribution of cell populations by their green and red fluorescence, for WT or ATE1-KO MEF, in untreated condition or treated with low-dose UV irradiations that are not expected to lead to significant cell death (two pulses of 20 J/m2 irradiations over 48 h, followed by 24 h recovery). The windows marked ‘B' were the gate setting used to quantify and sort red fluorescence-positive cells. (e) Quantification of mutated cells showing a red fluorescent signal in FACS in untreated or UV-irradiated cells from four independent repeats (n=4). In untreated condition, both WT and ATE1-KO cells have negligible numbers of revertants with no significant (NS, P>0.05) difference. After UV irradiations, although the WT cells have a moderate increase of revertants (~10 times), the increase in ATE1-KO is much larger (~100 times), resulting in a significant difference between the WT and KO cells. Error bar represents S.E.M. As mentioned before, the P-value was calculated by Student's t-test. (f) Representative fluorescent images of ATE1-KO MEFs stably expressing the reporter genes, either untreated or treated with UV irradiation and enriched for red fluorescent cells by FACS for culturing of up to 1 week. In untreated cells, no red fluorescence presented in any examined cells. In UV-irradiated and sorted cells, the vast majority of the examined cells have prominent red fluorescence, in addition to the green fluorescence from the internal expression marker GFP on the reporter construct, indicating that they are true revertants. The white arrow in the image points to a false-positive cell, which only has green fluorescence and not red fluorescence. Overall, <5% of false positive was found in the examined cells

