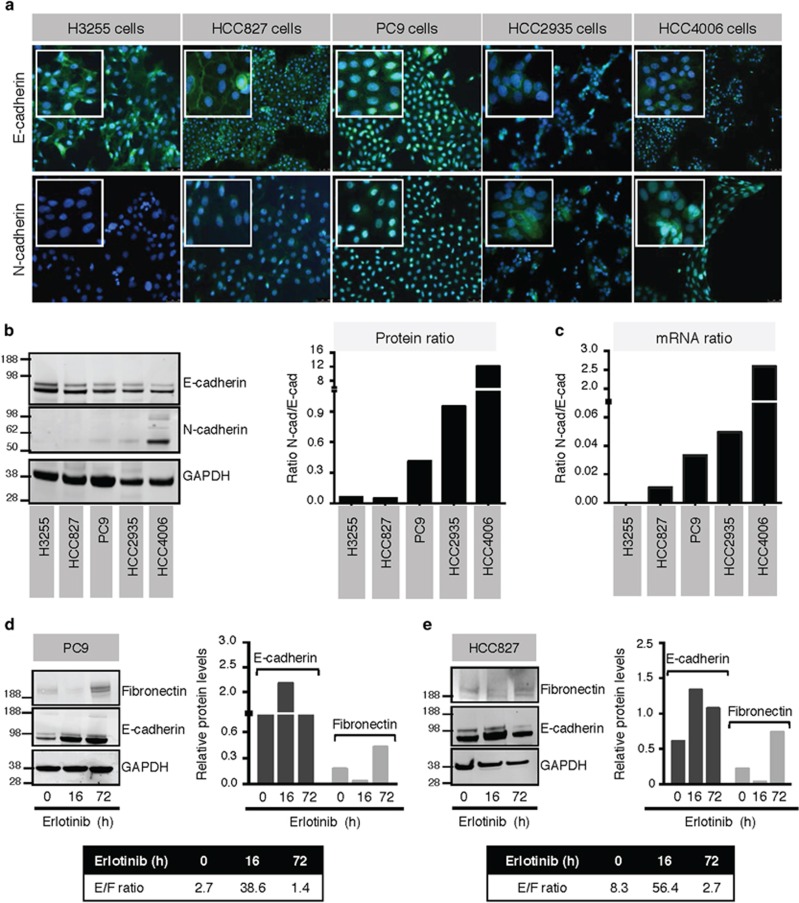
Figure 1.
Mutated NSCLC cell lines display varying EMT phenotypes. (a) Immunofluorescent and (b) western blot analysis of E-cadherin and N-cadherin expression in five mutated NSCLC cell lines. The ratio of N-cadherin: E-cadherin is also shown at the protein (b) and mRNA (c) levels. PC9 (d) and HCC827 (e) cells were treated with erlotinib for indicated times; lysates were evaluated via western blot for E-cadherin and fibronectin and quantified. Shown in the bar graph is the expression of each protein relative to GAPDH; the box shows the ratio of E-cadherin: fibronectin expression at each time point. Original magnification of all images: 20 × ; blue corresponds to 4′,6-diamidino-2-phenylindole (DAPI)-stained nuclei

