
Fig. 7.
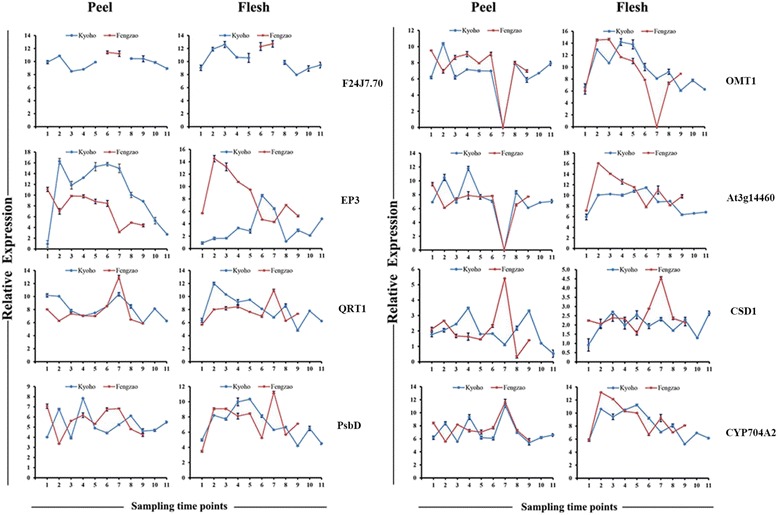
qRT-PCR expression patterns of 8 DEGs detected in the RNA-Seq profiles of WT and MT. The X-axis represents sampling time points corresponding to the 11 berry developmental stages of ‘Kyoho’ (see Fig. 1). The Y-axis represents the relative level of expression. The names of the assayed genes were indicated on the right sides of the panels: F24J7.70 (tmv resistance protein n-like), EP3 (class iv chitinase), QRT1 (pectinesterase qrt1), PsbD (photosystem ii protein d2), OMT1 (8-hydroxyquercetin 8-o-methyltransferase), At3g14460 (disease resistance protein at3g14460-like), CSD1(superoxide dismutase), and CYP704A2 (monooxygenase cyp704g7)