
Fig. 4.
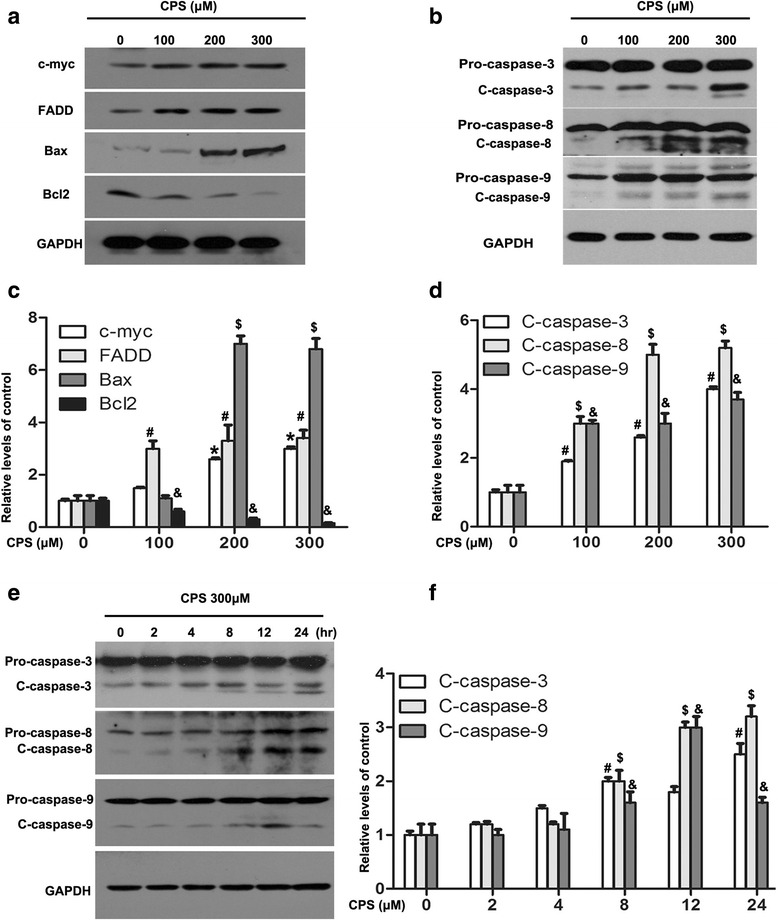
Alterations of apoptosis related proteins in 786-O cells after treated with CPS. a and b After 48 h CPS treatment with vary concentrations of CPS, c-myc, FADD, Bax, Bcl2, Caspase-3, -8, and -9 were analyzed in each sample by western blot. c Caspase-3, -8, and -9 were analyzed by western blot after incubation of 300 μM CPS for 0, 2, 4, 8, 12, 24 h. d, e, and f The quantitative data of the western blot of (a), (b), and (c), respectively. The values of each indicated protein mean relative density of the band normalized to GAPDH. Values represent the mean ± SD of three independent experiments. *,#,$,&P < 0.05 compared to the vehicle control groups, and statistic analysis was performed by One-Way ANOVA