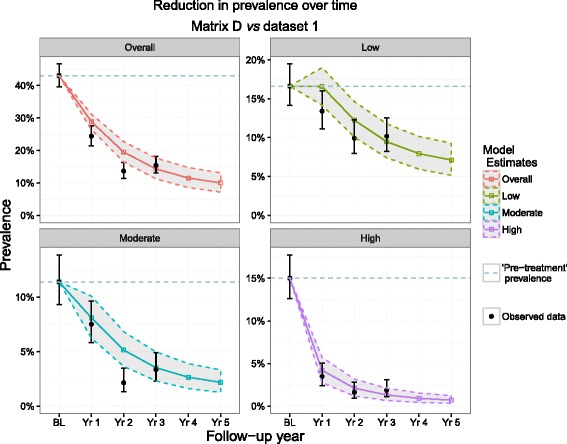
Fig. 4.

Matrix D predictions and dataset 1 observations. Matrix D was composed of transition probabilities derived from Mali baseline and year 1 data and dataset 1 represents the full longitudinal Ugandan observations. These 4 plots show the predicted reduction in prevalence by Matrix D (bands) vs observed (black points) in Uganda by overall prevalence group and by intensity group. The dotted line represents the pre-MDA prevalence
