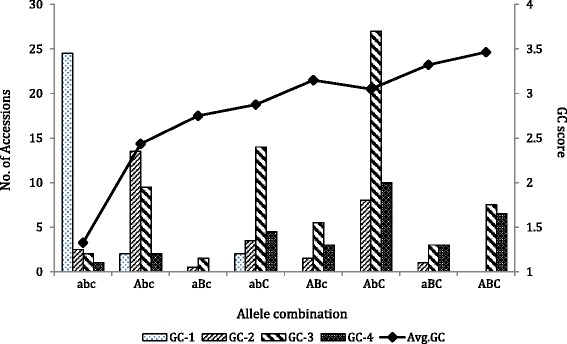
Fig. 3.

Distribution of grain color (GC) scores in the association mapping population predicted by Tamyb10 gene markers. Six allele combinations of three GC genes on chromosomes A, B and D separated 185 accessions into eight genotypes. Lower case represents a white grain allele and upper case represents a red grain allele in each locus. The three letters in each genotype represent three gene loci in the chromosomes A, B and D, respectively, e.g, Abc indicates red allele on 3A and white alleles on 3B and 3D. GC scores used a 1-4 scale with 1 for white grain and 4 for red grain
